Ever wanted to automate a mundane daily data task that collates regularly updated data and puts it onto a dashboard? Who hasn’t, right? Since late 2020, I have been building a COVID-19 daily case and death forecast and until recently, I was spending hours each day to build and tweak the model. Now that the model is finally tuned, I want it automated. Lucky for me the microservices on AWS and AWS Glue can handle this project from end-to-end.

In this tutorial, I’ll walk through how you can:

·        Create an automated data pull from GitHub using AWS Lambda, Amazon EventBridge and Amazon Elastic Compute Cloud (EC2),

·        Store your data in a data lake using Amazon Simple Storage Service (S3),

·        Run ETL (extract, transform, and load) jobs on your data in AWS Glue, and

·        Visualize that data in Amazon QuickSight.

First, draw out what we want to do:

  • Set up an automated dashboard displaying the number of COVID-19 cases and reported deaths per day in Santa Cruz, California
  • Use AWS Glue to send data to both Amazon Relational Database Service (RDS) for SQL Server, and an optimized csv file stored in my Amazon S3 data lake
  • Use Amazon QuickSight to render a professional dashboard (or use Tableau or Looker)
  • Use AWS Glue to perform the ETL, transforming raw data from the format Johns Hopkins stores it in into the optimized format we need for modeling and/or visualization, and finally loading it in to the Amazon RDS or Amazon S3 data lake
  • Use Amazon EC2 in order to run a GitHub pull every day and send the data to the Amazon S3 bucket in our data lake
  • Use AWS Lambda, triggered by an Amazon EventBridge event to fire up the Amazon EC2 instance every day for its daily GitHub pull

Before you begin: Anytime you are using different AWS services, be sure your resources are all in the same region. Do this by using the drop-down in the top-right corner of the AWS website header showing either a geographic region or the world “Global.” This will be especially important when trying to access your Amazon S3 bucket from AWS Glue.

Next, work backwards toward our main objective

This project uses data from the Johns Hopkins COVID-19 project that is updated every day on their GitHub. In order to be completely unrestricted by local machines or servers, I used Amazon EC2 to create an AWS Free Tier Virtual Machine instance and an Ubuntu environment where I could pull the GitHub data.

Create a virtual machine using Amazon EC2

If you are following along in this tutorial, create an Amazon EC2 instance using the basic, AWS Free Tier, Ubuntu 20.04 or 18.04. If you are reading this tutorial after January, 2023, then feel free to use version 22.04, but try to avoid the October releases as you’ll want your instance to be light and free of bugs. We won’t need much storage space because all we are going to use Amazon EC2 for is to clone a GitHub repository, and send the data to our data lake using the AWS Command Line Interface (CLI).

Next, Secure Shell (SSH) into your new Amazon EC2 virtual machine from your terminal. If you are using a Windows machine, you can SSH in from a Git Bash terminal, or PowerShell, or MobaXterm, or even PuTTY, if you must. You could also utilize the AWS Cloud9 integrated development environment (IDE) to do this.

Once inside your Linux box, make a directory in the new home directory called ‘jhu’ where you’ll clone the Git repository from the Johns Hopkins University Center for Systems Science and Engineering (JHU CSSE). For more information about the background of this data source, please read this article in the “Lancet.”

If you’ve never cloned a repository from GitHub, simply open up a web browser and open up a fresh page on duckduckgo.com, and type “johns hopkins covid github” into the search bar.

You should be able to click on the first result and go directly to the Johns Hopkins COVID-19 GitHub page. Once there, click on the big green button in the middle-right of the page that says “Code” and copy the link URL. If you’d like, you can fork and clone the whole repository, but for our purposes, we’ll only pull data from this source. We don’t have a need for any coding  worthy of a new forked Git repository.

Clone the Git repository into your new Amazon EC2 instance

You’ll want to name your instance for easy access later. I named mine “covpro-git-pull” to stay consistent with my COVID-19 program naming conventions, and to remind future me that this instance is only being used to pull data from a Git repository.

Earlier, we created a folder in our home directory called ‘jhu’. Go ahead and ‘cd’ into that directory now.  Once there, type:

$ git clone <paste-in-the-jhu-url>

Of course, replace the words above within brackets with the copied url from the Johns Hopkins GitHub repository. Hit enter. Your data is now downloading.

We’re going to build a Cron Job that automatically runs this pull every day at 8:00 am GMT, and then sends this data to your Amazon S3 bucket using the AWS CLI. Oddly enough, you cannot simply follow the directions on your Linux box to install the AWS CLI. Here’s the easy “how to” from a great web resource https://www.fosstechnix.com/how-to-install-aws-cli-on-ubuntu/

Push your data to Amazon S3

Don’t forget to configure your new AWS CLI. You do this by running the configure command,

$ aws configure

And then inputting your Access Key ID and  SECRET KEY when prompted. It’s a good idea to not fill in region or output format here because you don’t want to limit your Amazon EC2 instance. Instead just hit “enter” when prompted for these. Alternatively, you can choose the region that your Amazon S3 bucket is located in and the output format can be json.

Push the New Data to the Data Lake

We’re now going to push the raw data to our data lake using a simple Amazon S3 copy (cp) command, as follows:

$ aws s3 cp /home/ubuntu/jhu/COVID-19/csse_covid_19_data/csse_covid_19_time_series/time_series_covid19_confirmed_US.csv s3://<your-bucket-name>/data/

This will create a folder in your data bucket called ‘data’ and in that folder, it will put a copy of the time_series_covid19_confirmed_US.csv file from Johns Hopkins University (if it doesn’t work the first time, try manually creating a folder called ‘data’ inside of your Amazon S3 bucket). Repeat this step but this time, run it for the deaths csv as follows:

$ aws s3 cp /home/ubuntu/jhu/COVID-19/csse_covid_19_data/csse_covid_19_time_series/time_series_covid19_deaths_US.csv s3:// ://<your-bucket-name>/data/

Create an executable

We want to make sure that our Git pull updates all of the pertinent data prior to sending that data to our data lake. In order to do this, we’ll create an executable, or a bash program, which does those jobs in sequence. In my version, I use an output file to track each day’s updates so in the future when there is a bug in the program, I’ll have a log of the events that is easy to find and easy to read.

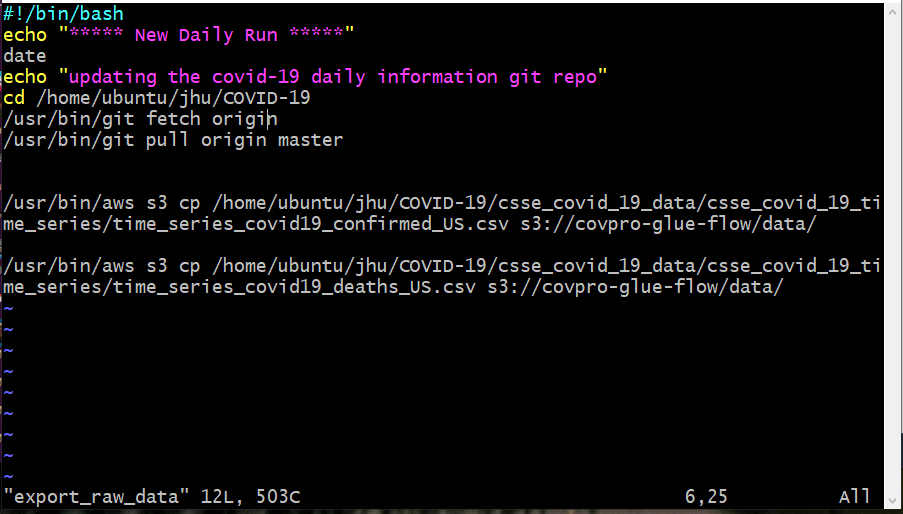
Once created, you’ll have to change the new text file to an executable using the command $ chmod u+x <filename>.

Put this into a Cron Job

We want to export this data automatically using a Cron Job on our Ubuntu instance. To do that, simply use the command,

$ crontab -e

Choose option 2 to use VIM (or GTFO), and then press enter. While in command mode, press SHIFT + G (at the same time) to move the cursor to the bottom of the file, press “i” to switch to insert mode, and use the following code to set your newly-created executable file to run automatically at 8:00 am GMT (or midnight pacific time):

00 08 * * * /home/ubuntu/bin/export_raw_data >> /home/ubuntu/data/cron_output

If for any reason you don’t know how to edit or get out of the file, hit the ‘escape’ key to go into the command mode, and hit the ‘i’ key to go into the insert mode. Then once you’ve entered the Cron code, hit escape again to go back to command mode and then enter ‘:’ + ‘wq’ to save (write to disk) and exit the file (quit).

:wq

Use AWS Lambda, Amazon EventBridge and Amazon EC2

AWS only charges you for the resources that you use within your cloud infrastructure. Ideally, this means that you don’t have to pay for a huge set of computers and servers that you aren’t using at an optimal level.

To manage costs, you should set up an AWS Lambda function which turns on and turns off your Amazon EC2 instance for you. That way, if you overrun the AWS Free Tier usage, you won’t be billed for continuously having the Amazon EC2 instance running when it’s not in use. Our use case will only need about 10 minutes per day, if that. There’s no reason to pay for 24 hours of Amazon EC2 time every day if we only need 10 minutes.

To do this, use Amazon CloudWatch Events (Amazon EventBridge), and a pair of functions in AWS Lambda (one to start and one to stop your instance). There’s a great article that shows you how to do this in the AWS documentation here.

Run Your ETL Job in AWS Glue

You’ve now created an automated workflow that inputs your data from the Johns Hopkins GitHub repository to your Data Lake in the Amazon S3 bucket. Next, you’ll want to transform that raw data into a usable format.

If you want, AWS Glue allows you to create a crawler, or a metadata program that will search your Amazon S3 bucket or Amazon RDS for SQL Server connection through Java Database Connectivity (JDBC) and seek out new data. When it finds new data, it will populate the appropriate metadata into a local Database Table in the AWS Glue environment, essentially creating a Hive data store.

You can then utilize PySpark or Spark SQL to run your transform on the new data found through that meta table.

For this tutorial, we’re going to use a script written in Python to go to the Amazon S3 bucket in our data lake, extract the data, transform it using the Python Data Analysis Library (Pandas), and then load it back in to our Amazon S3 bucket in a different folder. We can also choose to send this data to various data tables in a Relational Database System using the Amazon RDS, or even putting it into the Amazon Redshift data warehouse or Amazon Athena or Amazon Kinesis. Since the scope of our project involves making one data visualization, we’re keeping our transformed data simple by using Amazon S3, and not the bigger data stores.

Create an AWS Glue Job

Open up the AWS Glue console. On the left side of the screen, under the “ETL” heading, you should see an option called “Jobs.” Click that. After it opens, there will be a list of any current AWS Glue Jobs that you might have created. Click on the blue “Add job” button on the top left of that list and it will take you in to a setup wizard.

In the wizard, you’ll choose a name for this AWS Glue job (I’m staying with the same convention that I’ve been using and calling this the “covpro-glue-flow”). Pick your IAM role (You many need to create an IAM role that has AWS Glue Service Role access), and then choose the type of programming environment that you’d like to use.

AWS Glue is optimized for Spark so when you are running an ETL job on millions of lines of data, you can utilize the Resilient Distributed Dataset (RDD) clusters allowing you to run your job in parallel and minimize your compute times. This also helps you to not overrun your heap or overflow your stack in the cases of looping through millions of lines of data, by utilizing multiple processing units in parallel. PySpark is an API that lets us code in both Python and Spark at the same time, though beware in doing so, we may negate the advantage of Spark in the first place if we don’t understand what we’re asking the code to do.

In our case, even though we’re only going to use Python for this tutorial, we’ll select Spark instead of the Python Shell for our “Type” here, and for “Glue Version” we’ll select “Spark 2.4, Python 3 with improved job startup times (Glue Version 2.0)”. This way we can run our Python ETL script, and in the future, we can add PySpark code that will push the results into an Amazon RDS, or utilize the RDD in a revision.

The next question is asking us if we should run a script created by AWS or “A new script to be authored by you.” Choose this last option, “A new script” so we are able to copy-paste our pre-written python transform script into the code field.

Under “Advanced properties,” “Enable” the “Job Bookmark.” Then under “Monitoring Options,” check the boxes for “Job metrics” and “Continuous logging” so you can view error messages and monitor the success or failure of your job. If you’d like, add tags for tracking the expenses that your job costs you, and finally under the “Security configuration, script libraries, and job parameters (optional)” section, you’ll want to change your “Worker type” to “Standard” unless you plan on using the RDD, and the number of workers to “2”, which is the minimum. Using as little resources as needed is key to saving yourself costs in the cloud infrastructure.

Lastly, under the Catalog options, check the box to “Use Glue data catalog as the Hive metastore.” This way, if you want to utilize the metadata tables and a AWS Glue Crawler for a later iteration of your project, you’ll have access to the data.

Click Next.

On the next screen, under Connections, either choose the connection that you have set up with your Amazon S3 Data Lake, or skip ahead. You should not need to create a connection to the Amazon s3 if an option is not already laid out. The Connections option is typically set up for Amazon RDS, Amazon Redshift, or other databases or data warehouses.

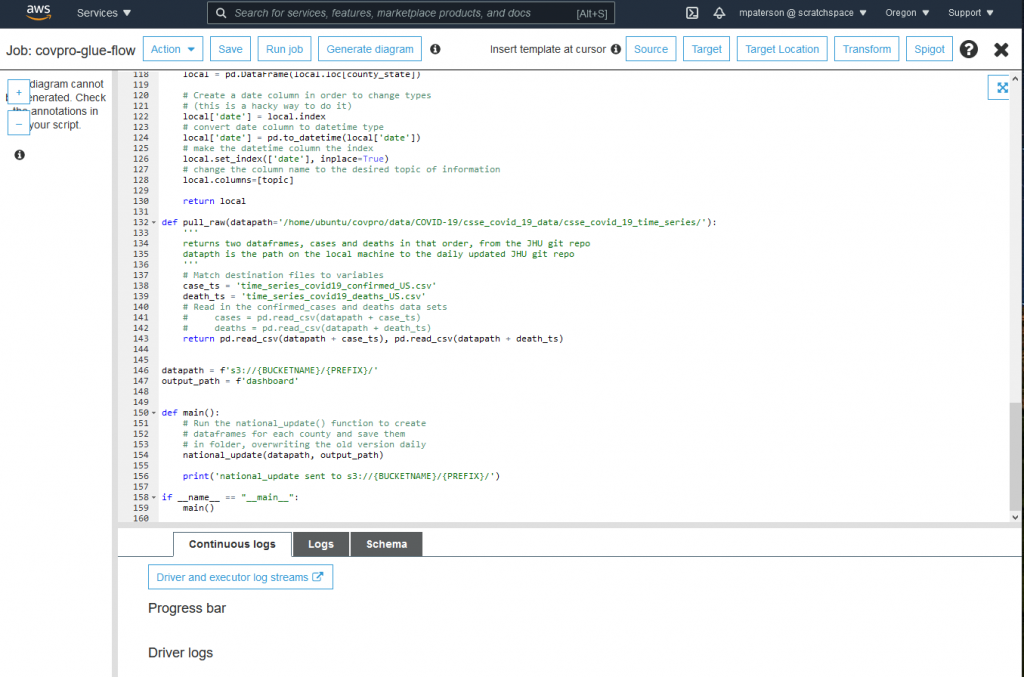
Now Click “Save Job and Edit Script.” This is where you’ll copy/paste your prepared Python SQL transform script. In our case, I have created a library called Steinbeck.py where I have built functions specifically to handle the transform of the Johns Hopkins COVID-19 Daily data and convert it into data for use in a daily dashboard for every county in the United States. For the purposes of this tutorial, I’ve modified that library into a single program with a main method. 

AND YOU’RE DONE (just kidding)

It’s almost that easy but you’ll still need to test your function and then automate it using a trigger.

Once you’ve pasted in your code (you’ll want to use code that works from your machine to get data from an Amazon S3 bucket, transform it, and place it back into an Amazon S3 bucket), you must click “Save” at the top of the screen. I always advise clicking “Save” a lot. I mean a LOT. In fact, click “Save” right now. Now do it again. It is so easy to lose months-worth of work by forgetting to click save.

Click “Save.”

Click “Run Job.”

This will take a minute. Since AWS Glue is built on Spark, it is optimized for huge amounts of data, not for what is in effect a small amount of data that we are using here. If you thought ahead, you would have put some print statements in your code so that you can monitor the results in your logs or in standard output (stdout). In this case, click the “Logs” button in the middle of the screen. It’s the one between “Continuous Logs” and “Schema.” This allows you to see what the jobs results are. If the job completes and you don’t see a sea of error messages to swim through, then your next step is to check your Data Lake for the results.

In my Amazon S3 bucket, I created a folder called “dashboard” where the results of the transform are sent. In my case, the transform created an individual data csv for each of the over 3,000 US counties, each showing the total confirmed cases, total deaths, and the new daily cases and new daily deaths for each county. I also have columns for per-capita numbers (cases and deaths per 100K residents).

If everything has worked so far, then it is time to create a trigger in AWS Glue. 

Set an AWS Glue Trigger

To automate this part of our workflow we won’t have to create a new AWS Lambda function or Amazon EventBridge event. Instead, we simply stay in our AWS Glue environment, and on the left margin, under the ETL section, we click on “Triggers.” This will open up a list of all of the available triggers. Since we just created a new AWS Glue job, we’ll click the blue button in the middle-left of the page that says “Add trigger” to create a new trigger and activate the setup wizard.

Name the trigger anything that you’d like. Again, I’ll stick with my convention and call this “covpro-glue-flow-trigger.” Next you’ll want to schedule the trigger, which is of course the whole point. You could choose to make your trigger dependent upon the successful completion of another AWS Glue job, especially if this were to be part of a full workflow with multiple transform processes such as Machine Learning Transforms, etcetera, but for now we will simply use the regular schedule.

You can use the drop-down menus to schedule your event, but beware that it uses UTC, or GMT, for its time. Thus, if you want a job to fire off at midnight in California, you’ll want to set it for 0800 GMT. You can always update and change this timing later, but when you do you’ll want to become familiar with Cron notation to do so.

Click “Next.” You will now need to find the job that you created before from the list of all of your AWS Glue Jobs on the left. Click “Add” next to the proper job. Once you have a job selected, you’ll be able to choose the “Parameters passed to job,” and here you’ll want to make sure your “Job bookmark” is “Enable”(d). Then click “Next” below, and on the following page, click “Finish.”

Last Step

Your last step will be to connect your data visualization software to your data lake. If you use Amazon QuickSight, you’ll be able to connect data from either your Amazon S3 bucket, your Amazon RDS for SQL Server database, MySQL or PostGreSQL, or your Amazon Redshift data warehouse directly to Amazon QuickSight dashboard tools. You can also use Tableau or Looker, programmatically connecting your data through either their native tools or by using an API or the command line interfaces of each service. Amazon QuickSight makes it easy to do in just a few steps. You’ll have to follow the directions to build the manifest file, but otherwise, it’s all in one place.

Here is an example of the finished product in Tableau. Here, I also added in the results of a DeepAR time series forecast that utilizes a Recurrent Neural Network (RNN) from MXNet’s Gluon library on AWS. This dashboard adds the California COVID-19 Restrictions Tier Color Codes as a filter to the dashboard visual, so you can see how the change in the local restrictions levels affected the spread and mortality of the disease in Santa Cruz, California.

VISIT us at https://cloudbrigade.com

If you enjoyed this tutorial and think your company could benefit from our technical know-how, please visit cloudbrigade.com and contact us to learn more!

What’s Next

If you like what you read here, the Cloud Brigade team offers expert Machine Learning as well as Big Data services to help your organization with its insights. We look forward to hearing from you.

Please reach out to us using our Contact Form with any questions.

If you would like to follow our work, please signup for our newsletter.

Background

Ever realize you’ve been spending too much of your time writing the same report or creating the same data visualization day after day, week after week? I have. Recently I’ve been putting together a data set from publicly available data and using it to train a time series forecast model before putting the resulting predictions onto a Tableau dashboard. Considering almost 100% of this was being done online or in the cloud already, I knew there was a better way. That’s when Chris Miller, founder and CEO of Cloud Brigade in Santa Cruz, California introduced me to AWS Glue. Now I can spend my time making data-driven decisions rather than building the same reports every day.

Challenge

Is there a way to utilize the AWS Cloud Infrastructure to automate my daily data collation, transformation and visualization?

Benefits

  • Dashboard is ready to view
  • Reduces decision-making time
  • Frees up human resources
  • Improves creativity

Business Challenges

Irresolvable Complexity: With AWS Glue, there’s no need to use multiple services, OAuth keys, daily manual extract, transform and load (ETL) jobs, or daily data uploads to a visualization tool.
Inefficient Systems/Processes: AWS Glue connects to your data lake in Amazon S3, your data collection source in Amazon Elastic Compute Cloud (EC2), and your Amazon QuickSight data visualization tools together seamlessly, using AWS Lambda and Amazon EventBridge to automate every step. Code it once and let it run.
Skills & Staffing Gaps: Free your Data Scientist, Data Engineer, Database Administrator, or DevOps and Software Engineers to do new and more exciting tasks every day by automating the workflows that already work.
Antiquated Technology: If you’re not leveraging cloud infrastructure to make your business more efficient and agile, what are you even doing?
Business Bottlenecks: Don’t let your decision-making be delayed by the creation of your reports.
Excessive Operational Costs: Like it or not, labor hours cost money, and you don’t want your software engineers or data scientists spending all of their time running the same old tasks that AWS Glue can automate for you.

Solution and Strategy:

The first thing I had to do was draw up the workflow on my whiteboard. Hey, even serverless tech relies on human thinking, and this human thinks best with the sweet smell of dry-erase marker.

Working Backwards:

  • Final Goal: An automated Amazon QuickSight or Tableau dashboard displaying the number of COVID-19 cases and reported deaths per day in Santa Cruz, California
  • Use AWS Glue to send an optimized csv file to my data lake in Amazon Simple Storage Service (S3)
  • Use AWS Glue to perform the ETL, transforming the raw data into the optimized format that we need for modeling and/or visualization
  • Use Amazon EC2 in order to run a Git pull every day and send the data to the Amazon S3 bucket in our data lake
  • Use AWS Lambda, triggered by an Amazon EventBridge event to fire up the Amazon EC2 instance every day for its daily Git pull

Technical Hurdles to Overcome:

Whether you’re using the AWS cloud infrastructure, a new smart watch, or even driving a John Deer Tractor, things don’t just work without some effort, trial and error.

For example, in the process of connecting these systems together, it is important that you are well versed in how to create new AWS Identity and Access Management (IAM) Policies and Roles. These are the security structures that control the permissions in your cloud infrastructure. “The Cloud” is just a nickname for the internet, after all, and so storing data up on the internet can leave it exposed to the nefarious actors that attack when your database is left unguarded. AWS IAM helps to keep your data and your systems safe, and it’s up to you to know how to properly wear this armor about your business.

Also, I learned the hard way that you have to keep your data lake and your data engineering environments in the same AWS Regions. If your Amazon S3 bucket is in Northern Virginia, for example, then your AWS Glue resources must also be built in the Northern Virginia region. The same is often true when running Machine Learning models in Amazon SageMaker, though the boto3 Python library has some workarounds there if you end up in the wrong part of the world…virtually speaking of course.

photo credit: https://66.media.tumblr.com/efa2a607446b42563825aecd6896bd20/tumblr_n236g2owQ11shn3beo1_1280.jpg

This Was No Ordinary Project

In most businesses, you’ll have data automatically uploaded to a database, often a MySQL database fed by a PHP front-end, and that data can be queried after a daily upload into a data warehouse. Often analysts and mid-level managers are spending 20-40 hours a week running queries and building dashboards to study changes in Key Performance Indicators (KPIs), only to have to run these same queries the following week and start all over again to measure the changes.

Using AWS Glue, we are now able to work with these businesses to free up those analysts to make data-driven decisions on what to do, rather than figuring out how to tell a story with the data in the first place.

Results

With some elbow grease, I was able to squeeze days worth of work into a seemingly instant end-to-end application.

Here is an example of the finished product in Tableau. I also added in the results of a DeepAR time series forecast that utilizes a Recurrent Neural Network (RNN) from MXNet’s Gluon library on AWS. This dashboard adds the California COVID-19 Restrictions Tier Color Codes as a filter to the dashboard visual, so you can see how the change in the local restrictions levels affected the spread and mortality of the disease in Santa Cruz, California.

“I love creating new ostensible demonstrations of data, and automating the whole workflow allows me to learn from the data visualizations and make data-driven decisions rather than spending all of my time putting reports together.“

-Matt Paterson, Data Scientist, Cloud Brigade

Want to try it yourself? Check out the detailed tutorial that I created for this project!

Think your business data reporting could use some streamlining? Contact us today to learn if a Cloud Brigade custom solution is right for you.

What’s Next

If you like what you read here, the Cloud Brigade team offers expert Machine Learning as well as Big Data services to help your organization with its insights. We look forward to hearing from you.

Please reach out to us using our Contact Form with any questions.

If you would like to follow our work, please signup for our newsletter.

Customer Service is perhaps one of my biggest pet peeves, and one of the few things in life which can make my blood boil. Most companies view the cost of customer service strictly on their bottom line, but the true cost is the burden on your customers. As Warren Buffet is known for saying about time – ”It’s the only thing you can’t buy.”

Let’s start with a bad customer service experience.

Six months ago I alerted one of our vendors to a problem with their service which was negatively impacting us. This was a technical problem which would require senior staff to get involved, and this represented a huge  bottleneck. We knew the problem was with their equipment, but none-the-less we were subject to a long drawn out troubleshooting process conducted by the front line staff. We were beholden to the gatekeeper to resolve this issue.

While our contact did reach out to us periodically to work through this process, getting them to send a technician to our office was deferred. Even when the tech showed up, they performed some rudimentary tests and promptly bailed assuming the problem was not on their end. Blood boiling, I summoned the tech back to our office where we found a $5 part on their end was the cause of the service degradation.

The time burn was colossal, financial costs non-trivial, not to mention the frustration. I still love this company which shall remain nameless, however this highlights an opportunity for them to become more customer focused. 

Let’s talk about a great customer service experience.

I recently purchased an e-bike from a local store in a move aimed at getting out of my car and getting more exercise. Last week my bike broke down unexpectedly, and I found myself stuck. I called the bike store at 5:15pm and told them of my predicament. Within 10 minutes an employee showed up (on his bike) with tools in hand to help resolve the issue.

One reason I bought my bike at Current E-Bikes was because they offered free lifetime tune-ups. It’s a great perk and indication of how they are customer centric. Rescuing me nearby is not part of this service, but the fact they went above and beyond at their expense earned them a top spot on my list of companies I will heartily recommend.

Amazon is well known for their “customer obsession.” In a 2016 letter to shareholders, Jeff Bezos said the following:

“Customers are always beautifully, wonderfully dissatisfied, even when they report being happy and business is great. Even when they don’t yet know it, customers want something better, and your desire to delight customers will drive you to invent on their behalf.”

It doesn’t matter what kind of product or service you offer, there is always room for improvement. As business owners this is something we need to continually remind ourselves. While we do have to consider the hard costs of providing customer service in relation to the profit margins of the product or service we sell, we also need to consider the hidden costs of bad customer service.

Priceless Marketing

When it comes to marketing, we all rely on our customers for referrals. While a happy customer will often praise your service when asked, an unhappy customer will seek opportunities to voice their experience. This negativity is a catalyst, resulting in an exponential impact on your growth, and a real cost on your customer acquisition costs. A referred customer comes to you with a high level of trust, and has a substantially lower acquisition cost than a customer who is new to your company.

Gatekeeping your customers with inexpensive and less knowledgeable “front line” staff may reduce your support costs, but you will pay handsomely in marketing and customer acquisition costs. Establishing an efficient escalation process in your support organization will minimize the time expenditure and frustration for your customer, and if properly handled will delight them and produce an advocate for your brand.

Good customer service requires continuous analysis and refinement. Consider establishing a process you conduct periodically to assess your customer experience so that you can make incremental improvements. Customer satisfaction surveys are an easy way to accomplish this, and although not everyone will fill them out, you will hear from your customers who are beautifully, wonderfully dissatisfied.

Join us in taking a moment to reassess your customer service strategy, and take a step toward becoming more customer obsessed:

  • Add functionality to your website to be more engaging
  • Conduct a Customer Service assessment and analysis 
  • Ask your customers – Create a Customer Service Survey
  • Add ticketing queues
  • Provide IT Support

Please get in touch via email or schedule a brief meeting to discuss enhancing your customer service strategy.

We also want to learn from your good customer service examples! Please comment below what made your experience so positive:

Background

Artificial Intelligence and Machine Learning have been in music creation for quite a while, (doing various things like correcting a singer’s pitch) but over the past few years I have seen apps, plugins and features that use machine learning to actually compose music.  I tried quite a few of them when they first started coming out, but the results I got felt like monkeys at a typewriter trying to belt out that Shakespearean play.  As such, they never made it into my studio as a permanent everyday tool.

As an AWS Select Consulting Partner, Cloud Brigade has accomplished several AWS Machine Learning projects.  So, when they sent our CEO, Chris Miller, an AWS DeepComposer keyboard, he offered it up to me knowing about my passion when it comes to digital music production. While I do understand the keyboard is intended to be a beginning tool for developers to get into machine learning and music, I figured my blend of software development and music creation knowledge might be what it takes to make good use of this solution. 

Challenge

Can an AWS machine learning software compose music? If so, how do we incorporate the AWS DeepComposer tool into a music studio, with a mix of hardware and software, and three different DAWs (Digital Audio Workstations)?

Benefits

  • Easy-to-use music composition tool
  • Provided automation and predictive analysis 
  • Integration with Ableton Live, SoundCloud and Musescore

Business Challenges

  • Irresolvable Complexity: Successfully integrated machine learning tool with music production software
  • Inefficient Systems and Processes: AWS DeepComposer gives music producers the opportunity to automate process while keeping individual creative integrity

Solution and Strategy

So the first thing I decided to do was figure out the workflow. How could I incorporate the AWS tool, as developer centric as it is, into a music studio?  My home music studio is pretty complicated.  I have a mix of hardware and software, and actually use three different DAWs.  When I am composing however, I usually stick to Ableton Live (digital audio workstation and instrument for live performances as well as a tool for composing, recording, arranging, mixing, and mastering), and needed to understand if I could move MIDI (Musical Instrument Digital Interface) data between Ableton Live and AWS DeepComposer.  I started up Live and loaded a song I was working on.  Knowing AWS DeepComposer did its magic based on a melody you give it, I exported a MIDI clip of the bassline. You can listen to here:

“AWS’ machine learning devices have really opened the door for our staff to explore the seemingly infinite opportunities to apply AI, and to produce new solutions to problems we weren’t even thinking about.”

-Chris Miller, Founder and CEO

Technical Hurdles to Overcome

Then I uploaded the AWS DeepComposer Music Studio and under the “Choose Input Track” dropdown and selected “Import a Track.” AWS DeepComposer returned some errors so it was time to troubleshoot.  Even though AWS says the MIDI file should be “8 bars or less,” I found it complained when I tried to import a 4 bar file, so I re-exported a 8 bar loop.  Then I got a message about missing BPM (Beats per Minute) data. After looking into Ableton’s MIDI export function, I found users reporting it does not embed BPM data.  What I needed at this point was a simple app I could use to add the BPM info.  After trying out a few, the one I found worked best was the notation software (and free) Musescore.  All I had to do is open the MIDI file and export as .mid.

So now I had my own “melody” in AWS DeepComposer and it was time to see what it can do.  I hit “Continue” but got an “Input track required” message.  Turns out you need to hit the “Edit Melody” then “Apply Changes” to get the MIDI file to register.

To continue, you’ll choose one of these three Machine Learning techniques: 

  1. Adding or subtracting notes from your melody
  2. Generating accompaniment tracks
  3. Extend your track by adding notes

Wanting to hear what it would do out of the box, I went with the 2nd option called GAN, as it had 5 pre-built models.  I picked rock, and hit “Continue.”  This was the result:

This Was No Ordinary Project

What you get is a 5 track composition (guitar, bass, pad, drums, and your original melody) played back through your computer’s built in synthesizer.  Much like all the other machine learning music generators I have tried, the initial result is often pretty chaotic sounding and not really usable as is, and unfortunately, your only choice of output/export is to upload an audio file to SoundCloud.  This is an AWS limitation, but my goal is to use this as an actual music tool and not just a cute demo.  After looking around quite a bit, I discovered how to get the MIDI into my DAW by using the “classic music studio.” 

In classic mode, there is a “Download Composition” button at the top to download a multitrack MIDI file of the loop AWS DeepComposer just created.  I had to rename the file extension to .mid (instead of .midi), but then it was ready to drop into my Ableton Live grid view. In this case I thought the Synthesizer Pad track had potential, so I chose a nice dreamy sound from Massive X, and tweaked it a tiny bit:

Results

Added it to my original bassline as well as some drums, and we have a nice little loop:

“I’m passionate about digital music production, and was super excited for the opportunity to blend by software development expertise to create the perfect little tune.”

-Rex Reyes, senior developer

Future Opportunities

So in the end, I did end up with a nice little chord progression, and one I will probably end up using in the final version.  Considering this is a tool not really intended for a music studio, it was pretty easy to get something usable from it.  As it stands, I will use it sporadically, but if I can figure out a way to route MIDI in and out of the app in real-time (my next goal), then it becomes a lot more usable.  I also plan on working with our ML guru, Matt Paterson, to see if we can’t create some of our own models.  I would love compositions requiring less cleanup, and ones more geared to my music genre. I am not sure about Amazon’s plans for DeepComposer, but I don’t think it would take too much work to get it integrated with professional music apps, and would be all in for that.

Download the full story here.

What’s Next

If you like what you read here, the Cloud Brigade team offers expert  Machine Learning as well as Software Development services to help your organization with its insights. We look forward to hearing from you.

Please reach out to us using our Contact Form with any questions.

If you would like to follow our work, please signup for our newsletter.

Ride Out The Wave proved that a community supported model in a time of crisis was possible. If you are interested in repeating the Ride Out the Wave model in your municipality, Santa Cruz Works is licensing the source code of the website on a case by case basis. This code is intended for use by civic organizations such as Chambers of Commerce, Economic Development Agencies, etc. You may request access using the form below.

The Ride Out The Wave website allows local businesses to create a listing with a link to their own Gift Card. Most business Point of Sale solutions allow the creation and host digital gift cards online. Examples include Square and Toast.

Once a listing is approved, the business information, gift card link, and image are added to the website automatically. Listings can be approved, denied, removed, or updated within a Google Sheet, and email messaging can be sent to the lister based on the change. The use of the website is quite simple. Implementation details are below the form.

There is some technical work required to setup the site, but the hosting fees are pretty trivial. If you do not have an engineer available to set this up for you, we are putting together some packages for installation, support, and training.

The website consists of three primary components and requires the following paid subscriptions :

  • Amazon Web Services (AWS) account
  • Google G-Suite account
  • Zapier

In order to install the website, the following skills are required :

  • AWS Console
  • AWS S3 + Cloud Front
  • AWS Lambda
  • AWS Cloud Watch Events
  • Google Forms
  • Google Sheets
  • Zapier Advanced Zaps

Please fill out the form and choose a support option, and someone will respond to you with additional information.

Ride Out The Wave Inquiry

DeepRacer Santa Cruz Meetup

DeepRacer is a 1/18th scale autonomous racing car with an onboard computer, camera, and a growing list of sensors such as Lidar and stereoscopic vision. Introduced at the AWS re:Invent 2018 conference, the official DeepRacer league has over 1500 members across the globe.

Managing Office Capacity with Data

It’s an increasingly common modern workplace problem. With hybrid work arrangements (those which allow workers to telecommute part time), many companies are grappling with how to manage their office space and capacity.

Cloud Brigade Business Intelligence Whitepaper

BI Whitepaper

Operating and scaling a professional services company is incredibly challenging. Every element of the business is in constant motion, and cash seems to fly out the door faster than it comes in.

Having fun with Serverless

The idea is that you can leave a digital object at a specific location, and share the object with someone, requiring that they show up to that location to find the object. That could be a 3D handwritten note, picture, or perhaps a 3D object.

Congrats on that thing you won ?!??

So I’ve been getting a lot of “Hey Congrats on that thing you won, um so what was it???”. .. allow me to simplify what just happened.

Central Coast Apprenticeship Summit

In recognition of National Apprenticeship Week, and to celebrate our recently developed apprenticeship opportunity, Cloud Brigade will be hosting the Central Coast Apprenticeship Summit on Wednesday, November 15th, 2017. Cloud Brigade, in collaboration with Cabrillo College and the Federal Department of Labor, recently developed the first of it’s kind Linux Support Specialist Apprenticeship. It is

The cloud v. data center decision

A new ZDNet/TechRepublic special report dives into a decision many companies are now facing: what to move to the cloud and what (if anything) to keep in the data center. ZDNet’s Charles McLellan kicks off this feature by taking a look at key trends in cloud and data center usage from the past year. TechRepublic’s

IT Ops Cost Determines Cloud Migration Value

By Clive Longbottom IT project requiring an assessment of present and predicted costs and savings falls into two categories: Capex and Opex. IT operating cost assessments are a vital part of proposing a cloud migration. IT must demonstrate both the department’s and the cloud’s business value. It’s time to baseline and estimate IT operating costs.

Clone Amazon S3 Data at Petabyte Scale

by Kate Miller | on 26 APR 2017 | in Amazon Glacier, Amazon S3, APN Technology Partners, Storage This is a guest post by Kelly Boeckman. Kelly is a Partner Manager at AWS who is focused on the Storage segment. Benjamin Franklin once famously said, “In this world nothing can be said to be certain,

$150K Grant to Build Workforce Training

The company has just applied for a $150k grant through the Mission Main Street Grants program. We are competing with companies across the country for 20 grants provided by Chase bank in a partnership with Google. In order to qualify we need to get 250 votes by October 17th. Why would a for-profit company need