text

Business Intelligence

Genius Level Intelligence

We can help you make sense of your data.

Business Intelligence (BI) is no longer a “nice to have” feature of your business, it’s essential to your success.

Business Intelligence (BI) is no longer a “nice to have” feature of your business, it’s essential to your success. The problem is most companies have more data than they know what to do with and taking the time to aggregate heaps of data across multiple databases and designing useful data visualizations sounds about as fun as a root canal on your birthday. Let us help you stay proactive with painless BI solutions.

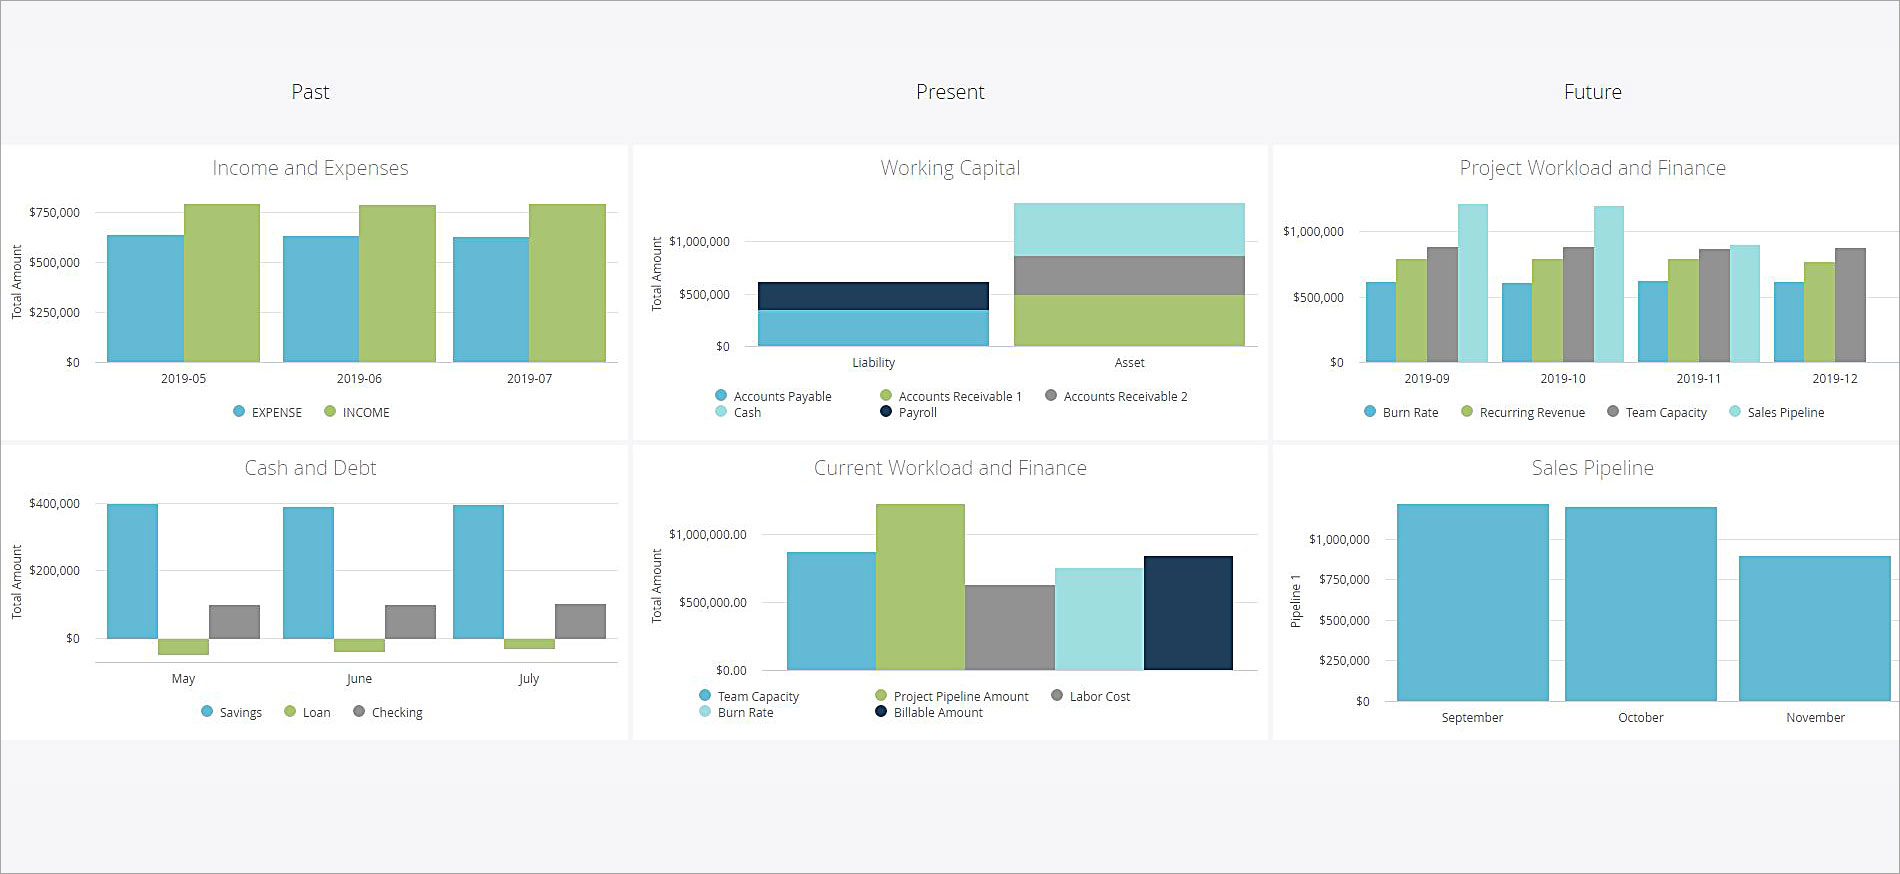
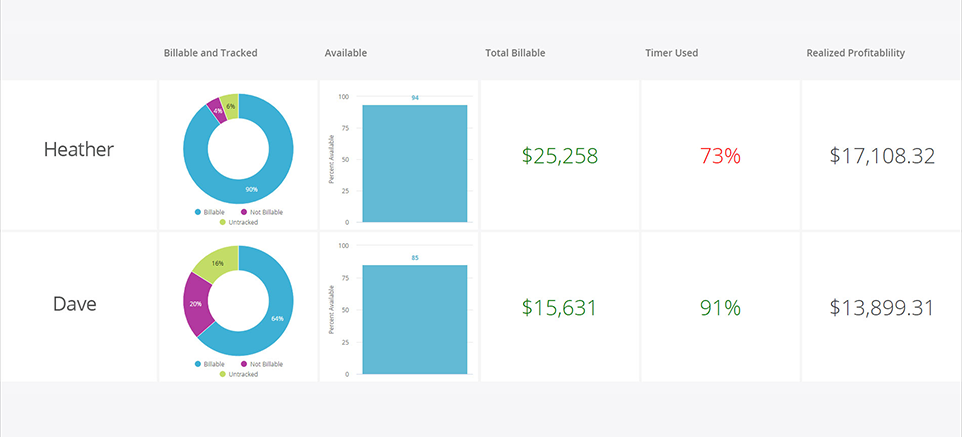
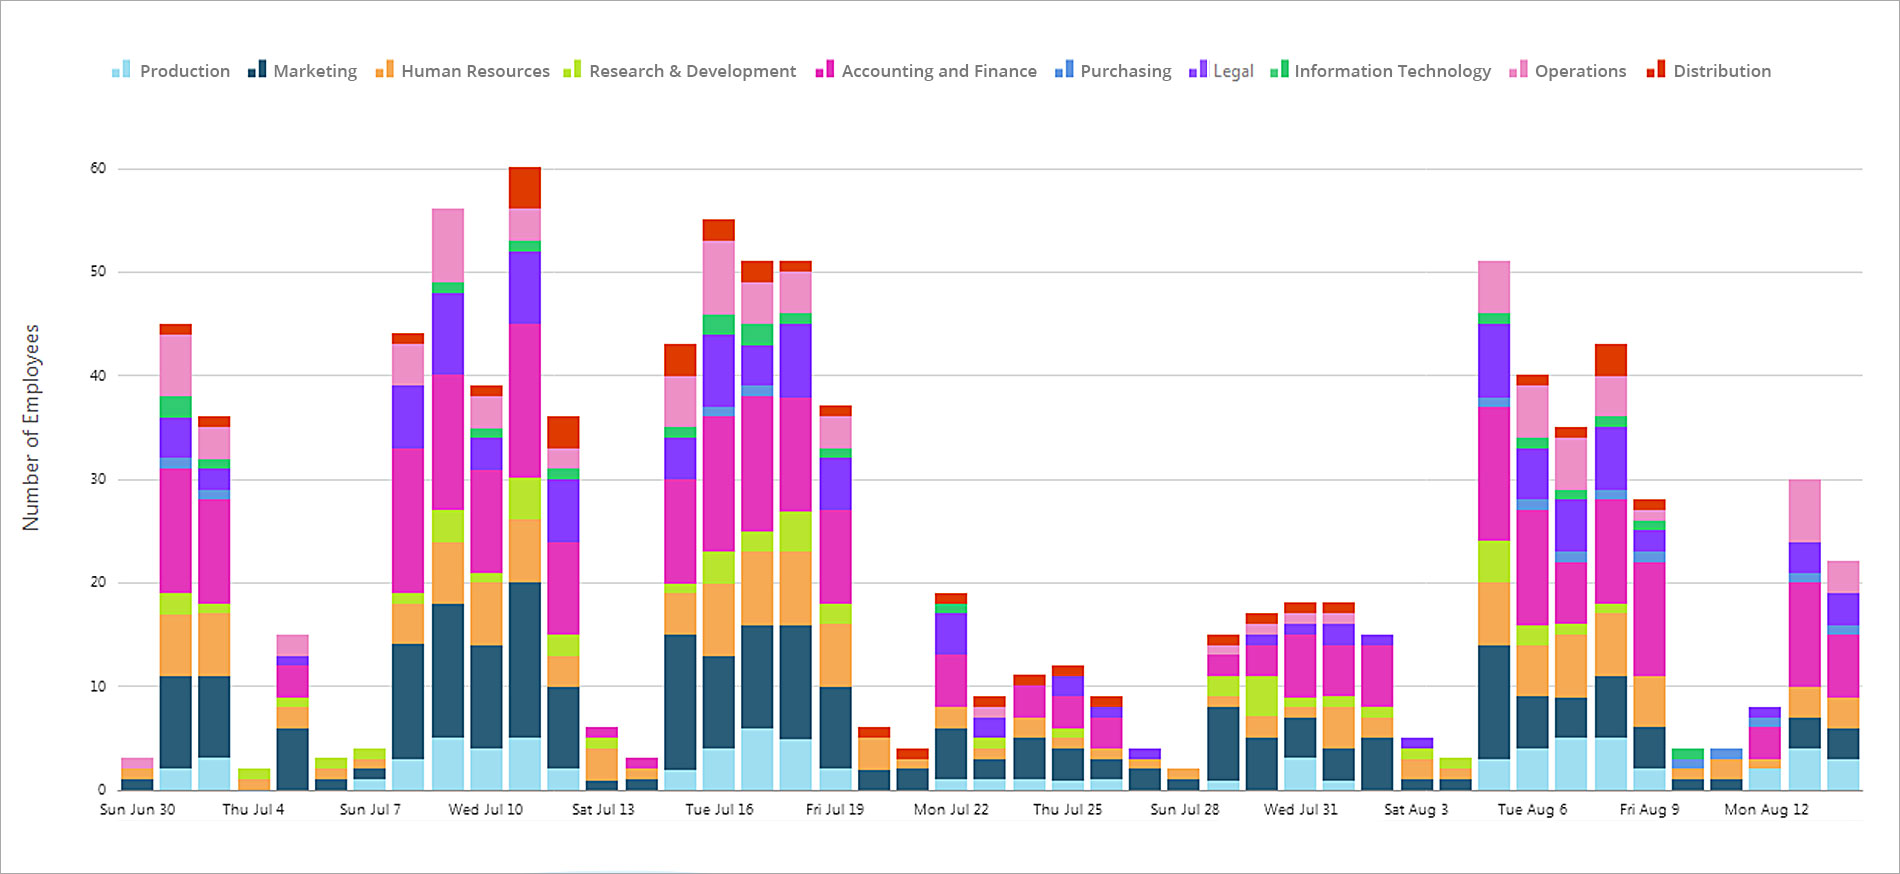
Our experienced data scientists can help make your analytics more efficient by organizing your data streams, capitalizing on hidden metrics, and extracting valuable insights to make available to everyone on your team:

Which of these challenges sound familiar?

Click to find out how we our Business Intelligence Services solved these problems:

BI Whitepaper

Operating and scaling a professional services company is incredibly challenging. Every element of the business is in constant motion, and cash seems to fly out the door faster than it comes in.

Read More…

Managing Office Capacity with Data

It’s an increasingly common modern workplace problem. With hybrid work arrangements (those which allow workers to telecommute part time), many companies are grappling with how to manage their office space and capacity.

Read More…

BI Whitepaper

Operating and scaling a professional services company is incredibly challenging. Every element of the business is in constant motion, and cash seems to fly out the door faster than it comes in.

Read More…

BI Whitepaper

Operating and scaling a professional services company is incredibly challenging. Every element of the business is in constant motion, and cash seems to fly out the door faster than it comes in.

Read More…

Get real-time insights of your company’s financial health in a single pane of glass, providing a past/present/future view at a glance, with meaningful drill-down capabilities to the underlying data.

Optimize your team’s productivity and financial output with real-time visibility of KPIs and warnings when staff may miss revenue targets. Keep apprised of attendance, billable time, and realized revenue.

Better manage your workplace capacity with historic presence information by department, team, or person. Discover opportunities to leverage your resources and limit waste.

Our Process

Discovery: First we need to acclimate to your IT environment and review your systems, networking, technology stack, and any available documentation. With fresh eyes we will compile a list of questions, concerns, and observations which we will present to you in a summary document. Upon review of these findings, we will provide a proposal including a list of suggested actions.

Export, Load, and Transform (ELT): This is the act of acquiring (export) the customer’s data from it’s various sources, including applications and databases. Next, we make strategic changes to the data (transform) making it more efficiently consumed. Last, we import (load) the data into the data warehouse.

Data Warehouse (DW): This is a place (usually a “Big Data” database, often in the cloud) where we aggregate all of your data in one place so Looker is able to run queries against the data. It’s basically a database of databases.

Data Modeling: A data model is a conceptual representation of data objects, the associations between different data objects, and the rules. Data modeling helps in the visual representation of data and enforces business rules, regulatory compliances, and government policies on the data. Data models ensure consistency in naming conventions, default values, semantics, and security, while ensuring quality of the data.

Visualizations: We then create custom dashboards which create visualizations of the data models.

Learn how we applied this process to our own data and team! Read the Whitepaper

Let’s discuss how we can help you.

Schedule Now

Clients

Technologies

Productivity and Financial Health Analytics

Learn how we aggregated data from multiple management tools into custom BI dashboards and smart reports allowing us to extract hidden metrics and valuable insights, making it all available to everyone on our team.

»» Read the Whitepaper

In our whitepaper we outline:

  • How we created a Financial Dashboard to give us a past/present/future view of our company’s financial health in a single pane of glass.

  • Helped optimize team productivity and financial output with real-time visibility of KPIs and warnings when staff may miss revenue targets.

  • How we embedded our analytics into a custom web portal, providing a feedback loop to all team members.