The Problem
It’s an increasingly common modern workplace problem. With hybrid work arrangements (those which allow workers to telecommute part time), many companies are grappling with how to manage their office space and capacity. We were approached by one of our clients with this exact problem. With an expensive office in San Francisco’s Financial District, they need to intelligently manage their available space to accommodate a rotating cast of employees.
As a large global non-profit, the organization has a complex org chart with many teams and departments. The office, an entire floor near the top of a skyscraper, is configured with a mix of dedicated desks, roaming seats, and shared conference rooms much like a coworking facility. The building is secured with RFID badges which restrict elevator and floor access as well as office entry.
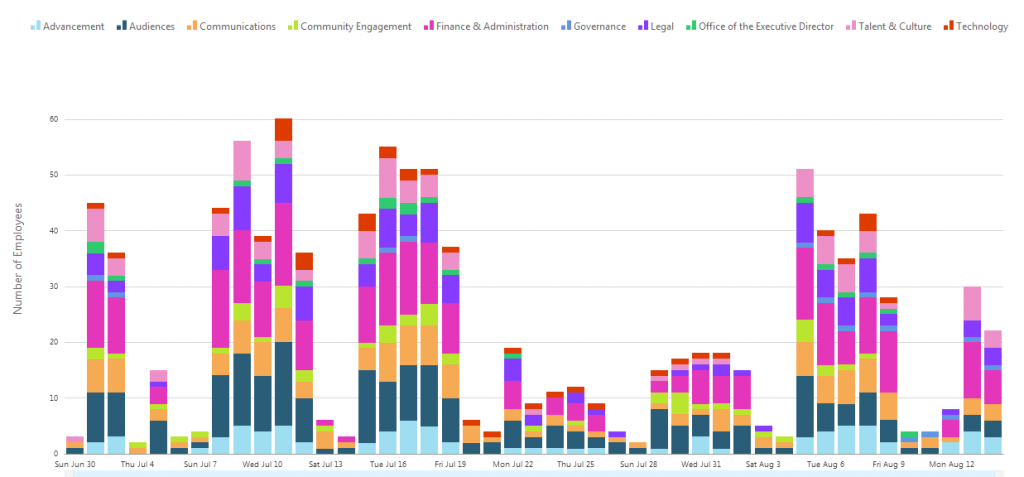
Cloud Brigade was tasked with providing a web based graphical tool to measure office usage and to provide for capacity planning. Expanding into additional space inside the building was going to be expensive, not just in lease costs, but the entire planning and improvement process. Our client needed to understand how the existing office space was being used, including :
- Total headcount per day
- Peak usage days
- Break down by department and team
- Conference room usage

Finding Clues with Data
Looking at the available sources, gaining access to the Brivo RFID card reader data was an obvious first step. Unfortunately with large elevator capacity, we were only capturing the first employee through the door. How then do you go about determining if an employee is actually in the building?
Next we looked at Google Suite data which tracks the logins of every employee and the public facing IP address. In this case Google provides a default session expiration time of 30 days. Although employees often authenticated more often than that, this simply wasn’t going to give us the granular data we needed.
Many employees with hybrid work arrangements use laptops, and those laptops connect to the internet using wifi. We were able to detect the presence of devices by their MAC address, a unique ID embedded into every device by the networking chip. Because our client also used Oomnitza, a digital asset tracking software, we were able to map company owned devices to an employee name. It was progress, but it still didn’t provide the level of accuracy we wanted.
The Meraki wifi network used a centralized authentication system based on LDAP, providing per-person access to resources, security, and efficient on/off-boarding of employees. Because each wifi user’s device authenticates (usually automatically) with a unique username upon arrival, we could accurately track the presence of those employees.
For the remainder of employees we still had an accuracy problem. It wasn’t just hardwired workstations which were “always on,” there were other edge cases such as contractors and other personal devices which were restricted to the guest network. What common tools did they login to which could provide a data point?
Lowering the default session time in Google G-Suite to 24 hours would provide a second data point (use of the office public IP address), but this provided two additional problems; it burdens the workers with more frequent logins, and also created false positives for remote workers who used the full-tunnel VPNs.
In the interest of brevity, we left a few minor collection and filtering methods out. As you can see by now we had several sources of data, but we couldn’t trust any one as the source of truth. The result was the creation of a scoring algorithm responsible for making sense of the available data and in order to provide the most accurate result.
In order to collect all this information we needed a system that could continuously consume API data in a reliable way without supervision. We also needed a series of graphs to display the data, ideally with the ability to drill down into the specifics. In the old days we would have written a series of collection scripts and a web application based on a currently popular framework. The problem is these one-off systems tend to break over time for a variety of reasons. They inevitably become the forgotten code running on shadow infrastructure, and fall victim to lack of maintenance.

Big Data to the Rescue
With better data management tools hitting the market each year, we could potentially leverage big data tools to deliver the end product. While this data was immensely valuable to our client and would likely save them six figures in various costs, the project didn’t justify the ongoing cost of the traditional enterprise tools we needed.
For enterprise Business Intelligence implementations, data is collected and aggregated through a process known as ETL or Export, Transform, and Load. These systems can be quite expensive, but an increasing number of these tools are available in the pay-as-you-go cloud services model. For as little as $1.50 a hour, we could leverage Matillion, a robust ETL platform to orchestrate our data acquisition and pump into a storage system.
Traditionally ETL systems pump the data into a data warehouse which is a database designed to deal with massive amounts of data. We had so little data that an expensive data warehouse was not feasible, nor was using a traditional SQL database which was not supported by Matillion. To solve this we leveraged SnowFlake, a data warehouse with pricing based on execution time, or put simply paying only for active use.
Last was building a dashboard with rich graphs, drill down capability, and multi-user access. It would be exorbitantly expensive to build this from scratch, or to leverage an enterprise grade BI platform. AWS came to the rescue with their QuickSight analytics service.
Tying it all Together
Cloud Brigade’s team worked with the stakeholders in the project (namely IT, facilities, and finance) to make sense of the data. We suggested unique ways we could correlate the data from all of the sources and determined the metrics which delivered the best actionable insights.
These projects are not strictly technical, this also requires an understanding and empathy for the people outside of the stakeholder team. We needed to achieve a reasonable business objective without burdening the employees or creating a “big brother” atmosphere.
At the end of the day we were able to provide a high quality and dependable business tool, in a reasonably short period of time, and with a relatively low total cost of ownership. To boot, it was yet another obscure and interesting problem our team got to solve with the right combination of really cool tools. For that we are grateful.

Wanna Learn More About Big Data?
