Ever wanted to automate a mundane daily data task that collates regularly updated data and puts it onto a dashboard? Who hasn’t, right? Since late 2020, I have been building a COVID-19 daily case and death forecast and until recently, I was spending hours each day to build and tweak the model. Now that the model is finally tuned, I want it automated. Lucky for me the microservices on AWS and AWS Glue can handle this project from end-to-end.
In this tutorial, I’ll walk through how you can:
· Create an automated data pull from GitHub using AWS Lambda, Amazon EventBridge and Amazon Elastic Compute Cloud (EC2),
· Store your data in a data lake using Amazon Simple Storage Service (S3),
· Run ETL (extract, transform, and load) jobs on your data in AWS Glue, and
· Visualize that data in Amazon QuickSight.
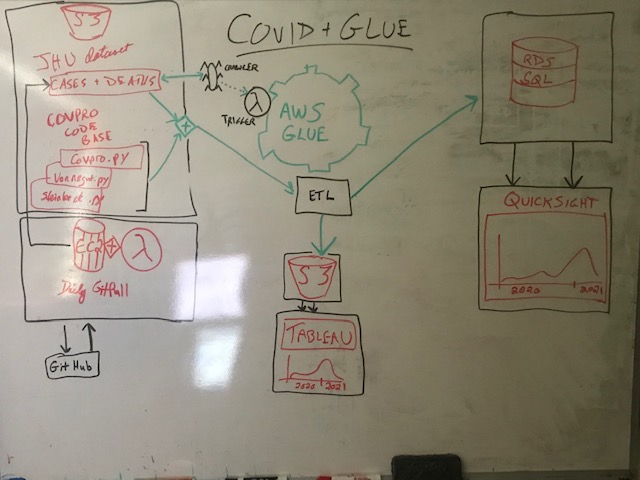
First, draw out what we want to do:
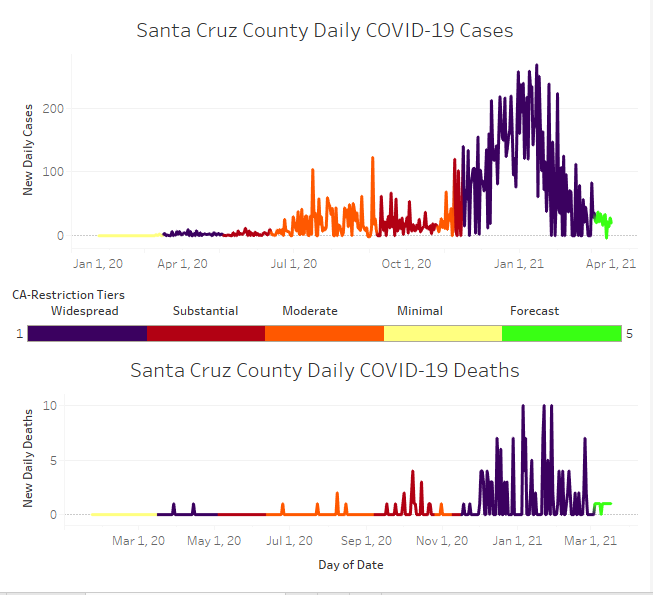
- Set up an automated dashboard displaying the number of COVID-19 cases and reported deaths per day in Santa Cruz, California
- Use AWS Glue to send data to both Amazon Relational Database Service (RDS) for SQL Server, and an optimized csv file stored in my Amazon S3 data lake
- Use Amazon QuickSight to render a professional dashboard (or use Tableau or Looker)
- Use AWS Glue to perform the ETL, transforming raw data from the format Johns Hopkins stores it in into the optimized format we need for modeling and/or visualization, and finally loading it in to the Amazon RDS or Amazon S3 data lake
- Use Amazon EC2 in order to run a GitHub pull every day and send the data to the Amazon S3 bucket in our data lake
- Use AWS Lambda, triggered by an Amazon EventBridge event to fire up the Amazon EC2 instance every day for its daily GitHub pull
Before you begin: Anytime you are using different AWS services, be sure your resources are all in the same region. Do this by using the drop-down in the top-right corner of the AWS website header showing either a geographic region or the world “Global.” This will be especially important when trying to access your Amazon S3 bucket from AWS Glue.
Next, work backwards toward our main objective
This project uses data from the Johns Hopkins COVID-19 project that is updated every day on their GitHub. In order to be completely unrestricted by local machines or servers, I used Amazon EC2 to create an AWS Free Tier Virtual Machine instance and an Ubuntu environment where I could pull the GitHub data.
Create a virtual machine using Amazon EC2
If you are following along in this tutorial, create an Amazon EC2 instance using the basic, AWS Free Tier, Ubuntu 20.04 or 18.04. If you are reading this tutorial after January, 2023, then feel free to use version 22.04, but try to avoid the October releases as you’ll want your instance to be light and free of bugs. We won’t need much storage space because all we are going to use Amazon EC2 for is to clone a GitHub repository, and send the data to our data lake using the AWS Command Line Interface (CLI).
Next, Secure Shell (SSH) into your new Amazon EC2 virtual machine from your terminal. If you are using a Windows machine, you can SSH in from a Git Bash terminal, or PowerShell, or MobaXterm, or even PuTTY, if you must. You could also utilize the AWS Cloud9 integrated development environment (IDE) to do this.
Once inside your Linux box, make a directory in the new home directory called ‘jhu’ where you’ll clone the Git repository from the Johns Hopkins University Center for Systems Science and Engineering (JHU CSSE). For more information about the background of this data source, please read this article in the “Lancet.”
If you’ve never cloned a repository from GitHub, simply open up a web browser and open up a fresh page on duckduckgo.com, and type “johns hopkins covid github” into the search bar.
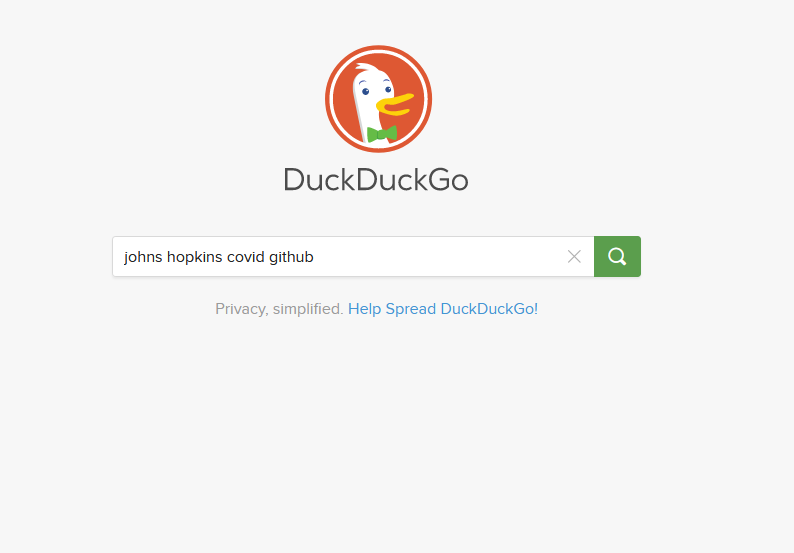
You should be able to click on the first result and go directly to the Johns Hopkins COVID-19 GitHub page. Once there, click on the big green button in the middle-right of the page that says “Code” and copy the link URL. If you’d like, you can fork and clone the whole repository, but for our purposes, we’ll only pull data from this source. We don’t have a need for any coding worthy of a new forked Git repository.
Clone the Git repository into your new Amazon EC2 instance
You’ll want to name your instance for easy access later. I named mine “covpro-git-pull” to stay consistent with my COVID-19 program naming conventions, and to remind future me that this instance is only being used to pull data from a Git repository.
Earlier, we created a folder in our home directory called ‘jhu’. Go ahead and ‘cd’ into that directory now. Once there, type:
$ git clone <paste-in-the-jhu-url>
Of course, replace the words above within brackets with the copied url from the Johns Hopkins GitHub repository. Hit enter. Your data is now downloading.
We’re going to build a Cron Job that automatically runs this pull every day at 8:00 am GMT, and then sends this data to your Amazon S3 bucket using the AWS CLI. Oddly enough, you cannot simply follow the directions on your Linux box to install the AWS CLI. Here’s the easy “how to” from a great web resource https://www.fosstechnix.com/how-to-install-aws-cli-on-ubuntu/
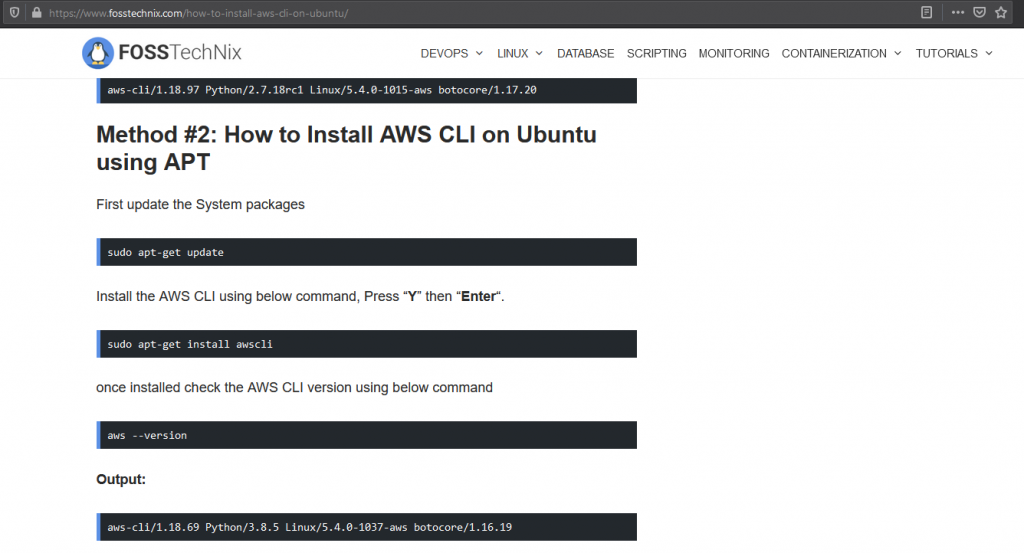
Push your data to Amazon S3
Don’t forget to configure your new AWS CLI. You do this by running the configure command,
$ aws configure
And then inputting your Access Key ID and SECRET KEY when prompted. It’s a good idea to not fill in region or output format here because you don’t want to limit your Amazon EC2 instance. Instead just hit “enter” when prompted for these. Alternatively, you can choose the region that your Amazon S3 bucket is located in and the output format can be json.
Push the New Data to the Data Lake
We’re now going to push the raw data to our data lake using a simple Amazon S3 copy (cp) command, as follows:
$ aws s3 cp /home/ubuntu/jhu/COVID-19/csse_covid_19_data/csse_covid_19_time_series/time_series_covid19_confirmed_US.csv s3://<your-bucket-name>/data/
This will create a folder in your data bucket called ‘data’ and in that folder, it will put a copy of the time_series_covid19_confirmed_US.csv file from Johns Hopkins University (if it doesn’t work the first time, try manually creating a folder called ‘data’ inside of your Amazon S3 bucket). Repeat this step but this time, run it for the deaths csv as follows:
$ aws s3 cp /home/ubuntu/jhu/COVID-19/csse_covid_19_data/csse_covid_19_time_series/time_series_covid19_deaths_US.csv s3:// ://<your-bucket-name>/data/
Create an executable
We want to make sure that our Git pull updates all of the pertinent data prior to sending that data to our data lake. In order to do this, we’ll create an executable, or a bash program, which does those jobs in sequence. In my version, I use an output file to track each day’s updates so in the future when there is a bug in the program, I’ll have a log of the events that is easy to find and easy to read.
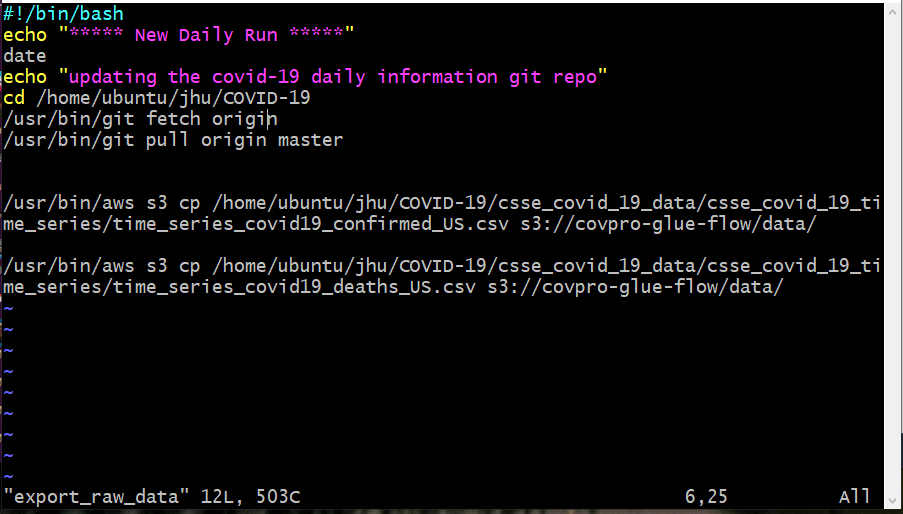
Once created, you’ll have to change the new text file to an executable using the command $ chmod u+x <filename>.
Put this into a Cron Job
We want to export this data automatically using a Cron Job on our Ubuntu instance. To do that, simply use the command,
$ crontab -e
Choose option 2 to use VIM (or GTFO), and then press enter. While in command mode, press SHIFT + G (at the same time) to move the cursor to the bottom of the file, press “i” to switch to insert mode, and use the following code to set your newly-created executable file to run automatically at 8:00 am GMT (or midnight pacific time):
00 08 * * * /home/ubuntu/bin/export_raw_data >> /home/ubuntu/data/cron_output
If for any reason you don’t know how to edit or get out of the file, hit the ‘escape’ key to go into the command mode, and hit the ‘i’ key to go into the insert mode. Then once you’ve entered the Cron code, hit escape again to go back to command mode and then enter ‘:’ + ‘wq’ to save (write to disk) and exit the file (quit).
:wq
Use AWS Lambda, Amazon EventBridge and Amazon EC2
AWS only charges you for the resources that you use within your cloud infrastructure. Ideally, this means that you don’t have to pay for a huge set of computers and servers that you aren’t using at an optimal level.
To manage costs, you should set up an AWS Lambda function which turns on and turns off your Amazon EC2 instance for you. That way, if you overrun the AWS Free Tier usage, you won’t be billed for continuously having the Amazon EC2 instance running when it’s not in use. Our use case will only need about 10 minutes per day, if that. There’s no reason to pay for 24 hours of Amazon EC2 time every day if we only need 10 minutes.
To do this, use Amazon CloudWatch Events (Amazon EventBridge), and a pair of functions in AWS Lambda (one to start and one to stop your instance). There’s a great article that shows you how to do this in the AWS documentation here.
Run Your ETL Job in AWS Glue
You’ve now created an automated workflow that inputs your data from the Johns Hopkins GitHub repository to your Data Lake in the Amazon S3 bucket. Next, you’ll want to transform that raw data into a usable format.
If you want, AWS Glue allows you to create a crawler, or a metadata program that will search your Amazon S3 bucket or Amazon RDS for SQL Server connection through Java Database Connectivity (JDBC) and seek out new data. When it finds new data, it will populate the appropriate metadata into a local Database Table in the AWS Glue environment, essentially creating a Hive data store.
You can then utilize PySpark or Spark SQL to run your transform on the new data found through that meta table.
For this tutorial, we’re going to use a script written in Python to go to the Amazon S3 bucket in our data lake, extract the data, transform it using the Python Data Analysis Library (Pandas), and then load it back in to our Amazon S3 bucket in a different folder. We can also choose to send this data to various data tables in a Relational Database System using the Amazon RDS, or even putting it into the Amazon Redshift data warehouse or Amazon Athena or Amazon Kinesis. Since the scope of our project involves making one data visualization, we’re keeping our transformed data simple by using Amazon S3, and not the bigger data stores.
Create an AWS Glue Job
Open up the AWS Glue console. On the left side of the screen, under the “ETL” heading, you should see an option called “Jobs.” Click that. After it opens, there will be a list of any current AWS Glue Jobs that you might have created. Click on the blue “Add job” button on the top left of that list and it will take you in to a setup wizard.
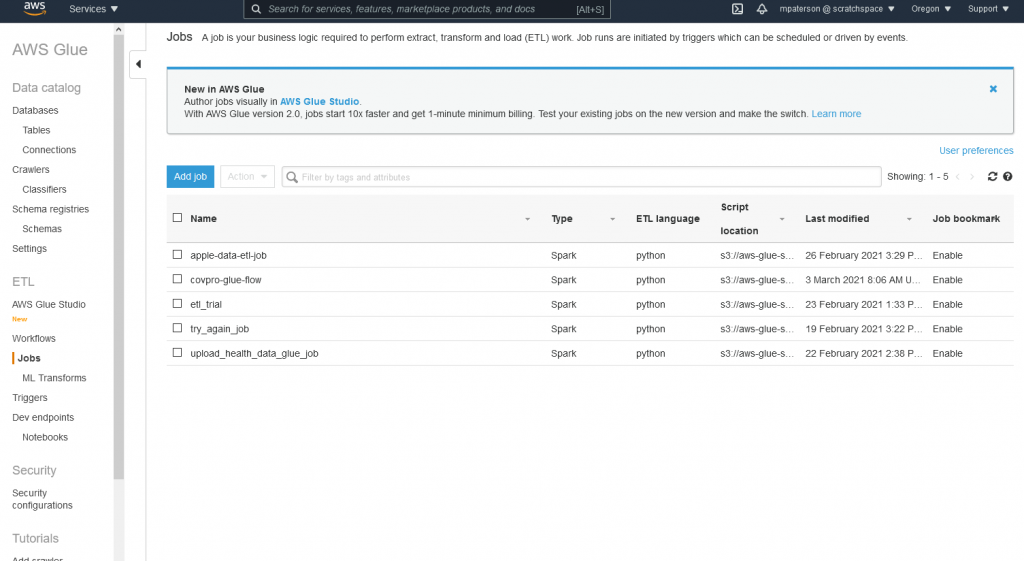
In the wizard, you’ll choose a name for this AWS Glue job (I’m staying with the same convention that I’ve been using and calling this the “covpro-glue-flow”). Pick your IAM role (You many need to create an IAM role that has AWS Glue Service Role access), and then choose the type of programming environment that you’d like to use.
AWS Glue is optimized for Spark so when you are running an ETL job on millions of lines of data, you can utilize the Resilient Distributed Dataset (RDD) clusters allowing you to run your job in parallel and minimize your compute times. This also helps you to not overrun your heap or overflow your stack in the cases of looping through millions of lines of data, by utilizing multiple processing units in parallel. PySpark is an API that lets us code in both Python and Spark at the same time, though beware in doing so, we may negate the advantage of Spark in the first place if we don’t understand what we’re asking the code to do.
In our case, even though we’re only going to use Python for this tutorial, we’ll select Spark instead of the Python Shell for our “Type” here, and for “Glue Version” we’ll select “Spark 2.4, Python 3 with improved job startup times (Glue Version 2.0)”. This way we can run our Python ETL script, and in the future, we can add PySpark code that will push the results into an Amazon RDS, or utilize the RDD in a revision.
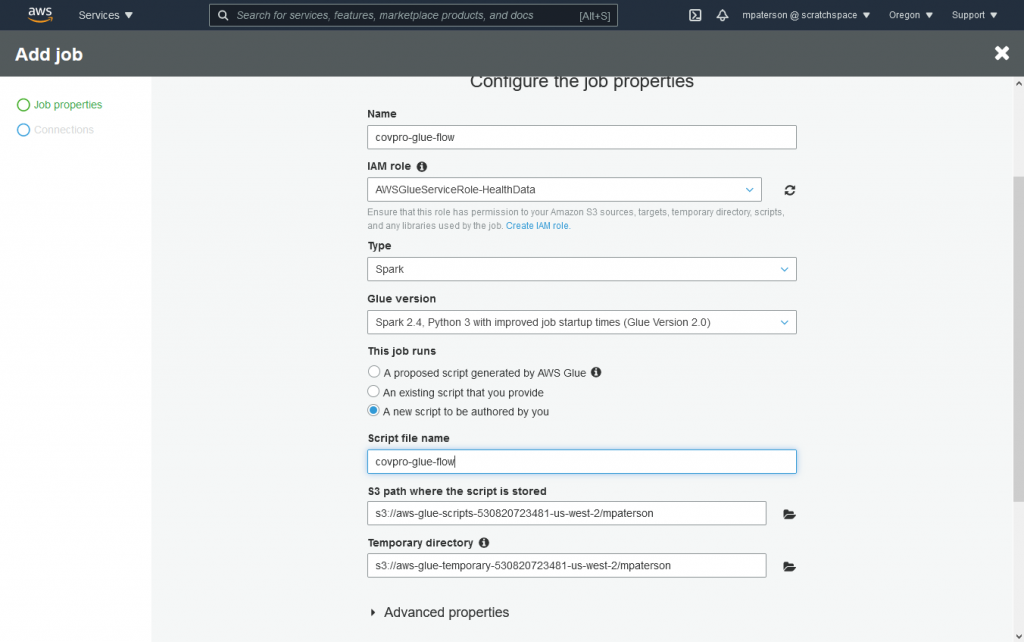
The next question is asking us if we should run a script created by AWS or “A new script to be authored by you.” Choose this last option, “A new script” so we are able to copy-paste our pre-written python transform script into the code field.
Under “Advanced properties,” “Enable” the “Job Bookmark.” Then under “Monitoring Options,” check the boxes for “Job metrics” and “Continuous logging” so you can view error messages and monitor the success or failure of your job. If you’d like, add tags for tracking the expenses that your job costs you, and finally under the “Security configuration, script libraries, and job parameters (optional)” section, you’ll want to change your “Worker type” to “Standard” unless you plan on using the RDD, and the number of workers to “2”, which is the minimum. Using as little resources as needed is key to saving yourself costs in the cloud infrastructure.
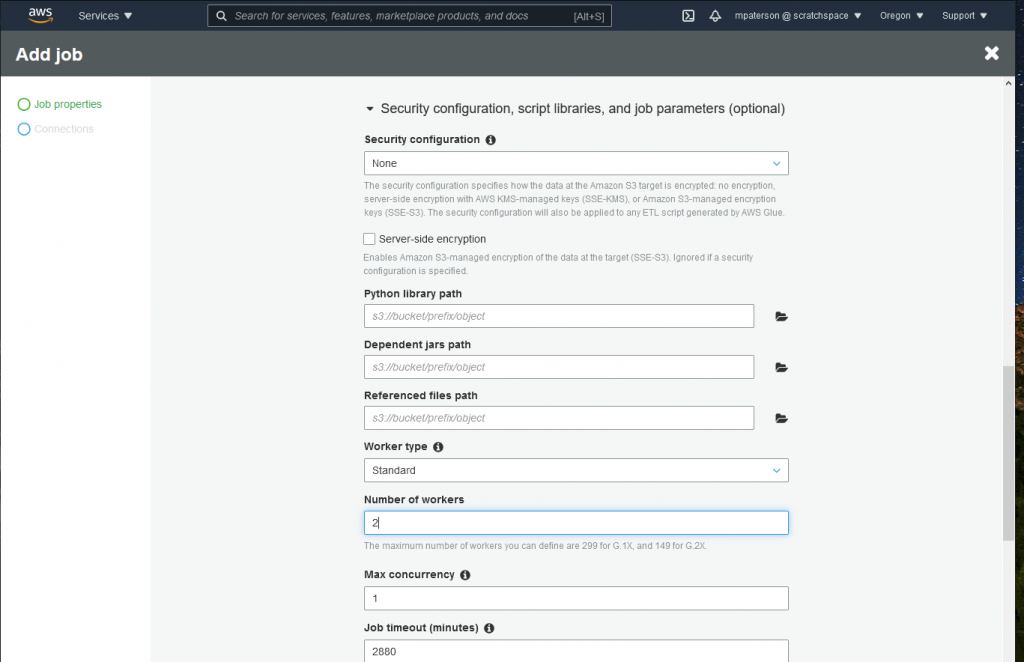
Lastly, under the Catalog options, check the box to “Use Glue data catalog as the Hive metastore.” This way, if you want to utilize the metadata tables and a AWS Glue Crawler for a later iteration of your project, you’ll have access to the data.
Click Next.
On the next screen, under Connections, either choose the connection that you have set up with your Amazon S3 Data Lake, or skip ahead. You should not need to create a connection to the Amazon s3 if an option is not already laid out. The Connections option is typically set up for Amazon RDS, Amazon Redshift, or other databases or data warehouses.
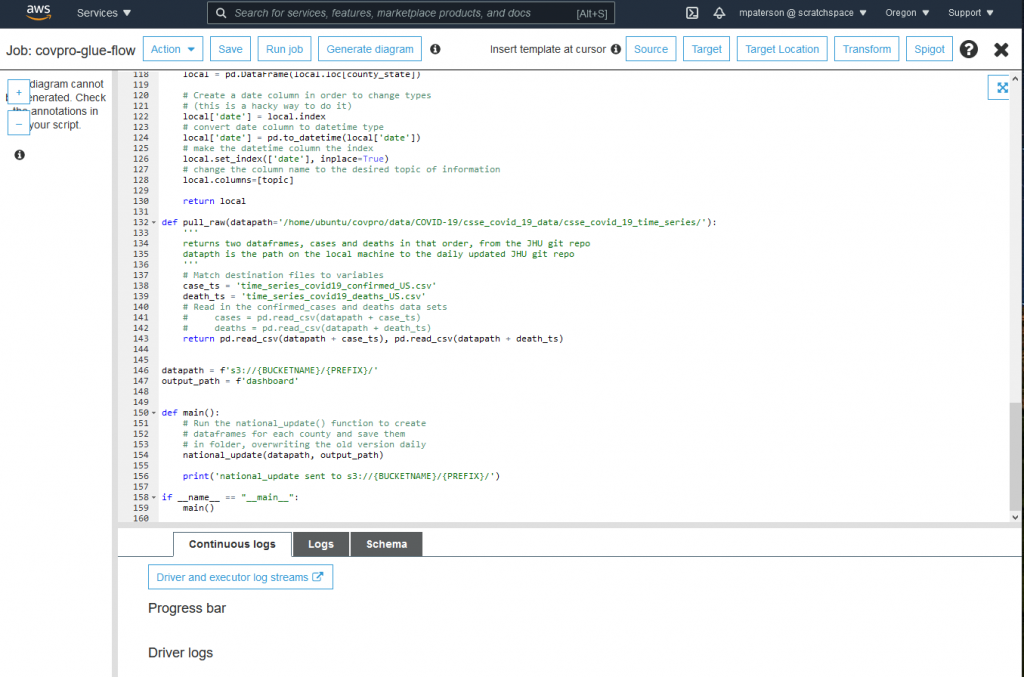
Now Click “Save Job and Edit Script.” This is where you’ll copy/paste your prepared Python SQL transform script. In our case, I have created a library called Steinbeck.py where I have built functions specifically to handle the transform of the Johns Hopkins COVID-19 Daily data and convert it into data for use in a daily dashboard for every county in the United States. For the purposes of this tutorial, I’ve modified that library into a single program with a main method.
AND YOU’RE DONE (just kidding)
It’s almost that easy but you’ll still need to test your function and then automate it using a trigger.
Once you’ve pasted in your code (you’ll want to use code that works from your machine to get data from an Amazon S3 bucket, transform it, and place it back into an Amazon S3 bucket), you must click “Save” at the top of the screen. I always advise clicking “Save” a lot. I mean a LOT. In fact, click “Save” right now. Now do it again. It is so easy to lose months-worth of work by forgetting to click save.
Click “Save.”
Click “Run Job.”
This will take a minute. Since AWS Glue is built on Spark, it is optimized for huge amounts of data, not for what is in effect a small amount of data that we are using here. If you thought ahead, you would have put some print statements in your code so that you can monitor the results in your logs or in standard output (stdout). In this case, click the “Logs” button in the middle of the screen. It’s the one between “Continuous Logs” and “Schema.” This allows you to see what the jobs results are. If the job completes and you don’t see a sea of error messages to swim through, then your next step is to check your Data Lake for the results.
In my Amazon S3 bucket, I created a folder called “dashboard” where the results of the transform are sent. In my case, the transform created an individual data csv for each of the over 3,000 US counties, each showing the total confirmed cases, total deaths, and the new daily cases and new daily deaths for each county. I also have columns for per-capita numbers (cases and deaths per 100K residents).
If everything has worked so far, then it is time to create a trigger in AWS Glue.
Set an AWS Glue Trigger
To automate this part of our workflow we won’t have to create a new AWS Lambda function or Amazon EventBridge event. Instead, we simply stay in our AWS Glue environment, and on the left margin, under the ETL section, we click on “Triggers.” This will open up a list of all of the available triggers. Since we just created a new AWS Glue job, we’ll click the blue button in the middle-left of the page that says “Add trigger” to create a new trigger and activate the setup wizard.
Name the trigger anything that you’d like. Again, I’ll stick with my convention and call this “covpro-glue-flow-trigger.” Next you’ll want to schedule the trigger, which is of course the whole point. You could choose to make your trigger dependent upon the successful completion of another AWS Glue job, especially if this were to be part of a full workflow with multiple transform processes such as Machine Learning Transforms, etcetera, but for now we will simply use the regular schedule.
You can use the drop-down menus to schedule your event, but beware that it uses UTC, or GMT, for its time. Thus, if you want a job to fire off at midnight in California, you’ll want to set it for 0800 GMT. You can always update and change this timing later, but when you do you’ll want to become familiar with Cron notation to do so.
Click “Next.” You will now need to find the job that you created before from the list of all of your AWS Glue Jobs on the left. Click “Add” next to the proper job. Once you have a job selected, you’ll be able to choose the “Parameters passed to job,” and here you’ll want to make sure your “Job bookmark” is “Enable”(d). Then click “Next” below, and on the following page, click “Finish.”
Last Step
Your last step will be to connect your data visualization software to your data lake. If you use Amazon QuickSight, you’ll be able to connect data from either your Amazon S3 bucket, your Amazon RDS for SQL Server database, MySQL or PostGreSQL, or your Amazon Redshift data warehouse directly to Amazon QuickSight dashboard tools. You can also use Tableau or Looker, programmatically connecting your data through either their native tools or by using an API or the command line interfaces of each service. Amazon QuickSight makes it easy to do in just a few steps. You’ll have to follow the directions to build the manifest file, but otherwise, it’s all in one place.
Here is an example of the finished product in Tableau. Here, I also added in the results of a DeepAR time series forecast that utilizes a Recurrent Neural Network (RNN) from MXNet’s Gluon library on AWS. This dashboard adds the California COVID-19 Restrictions Tier Color Codes as a filter to the dashboard visual, so you can see how the change in the local restrictions levels affected the spread and mortality of the disease in Santa Cruz, California.
VISIT us at https://cloudbrigade.com
If you enjoyed this tutorial and think your company could benefit from our technical know-how, please visit cloudbrigade.com and contact us to learn more!
What’s Next
If you like what you read here, the Cloud Brigade team offers expert Machine Learning as well as Big Data services to help your organization with its insights. We look forward to hearing from you.
Please reach out to us using our Contact Form with any questions.
If you would like to follow our work, please signup for our newsletter.