Intro
Few businesses operate without a website these days, a necessary tool that allows your organization to connect with the world. The impact a website can have is often underestimated as many business leaders may have no idea what is really happening on their website. Vanity metrics like the number of visitors per month, bounce rate, and referral source don’t begin to tell the story.
Information is power as they say, and whether you want to just see ROI on your website investment, or leverage this asset as a growth catalyst, one must deeply and intimately understand how users find and engage with your website. Once limited to enterprise companies, deep marketing analytics are within reach of smaller organizations. In many cases, you just need a little help from a trusted partner.
Problem
Google Analytics has been the gold standard in basic website analytics, it’s free and provides a wealth of information. For all its power, lots of correlations are missing. The reasons are many and range from privacy concerns to pay-to-play analytics provided through other services like ads. New privacy laws also complicate this landscape.
The biggest problem we see is that _if_ the website owner has enabled Google Analytics, they rarely, if ever, look at it. Although the information is interesting and does provide some insights, understanding the information is not intuitive without knowledge around key metrics and indicators. Even worse, the metrics don’t provide any insight into what needs improvement.
How do I get more visitors to my website? What interests actually brought them here? Did they find what they are looking for? Did they even read our content, or just bounce to a competing website? These questions can’t be answered when the website is on auto-pilot.
Basic Analytics Explained
Before we dive into enhanced analytics, it’s important to have an understanding of the basics. If you are familiar with Google Analytics, you can skip to the next section. A few of the common metrics will give you a basic idea about the traffic coming to your website, we’ll explain these concepts below.
Audience
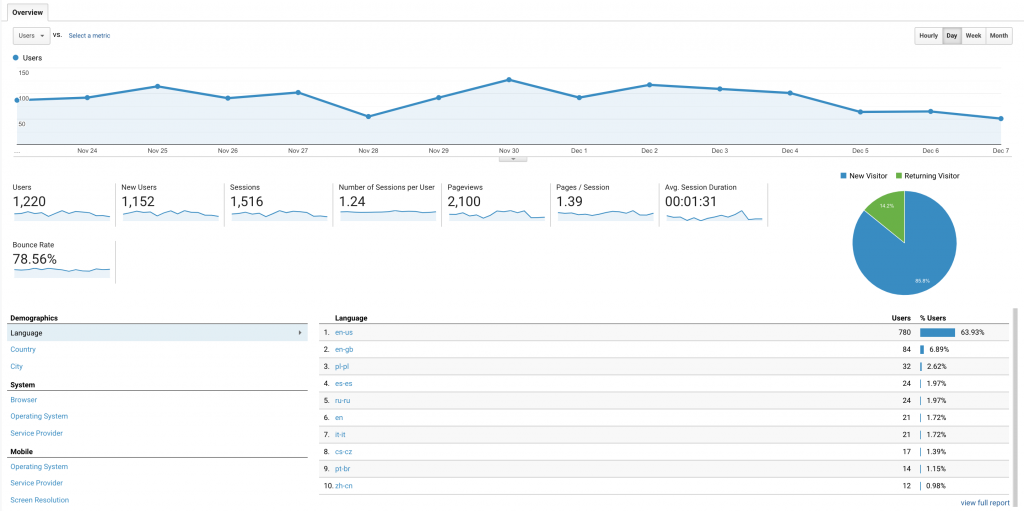
Audience metrics tell you how many users come to your website, how many are repeat visitors, for how long, and how much do they engage with your content. Bounce Rate is a key indicator, as a high bounce rate means that visitors, on average, weren’t engaging with your content. They looked at one or two pages, didn’t spend a lot of time, and “bounced.” It usually means they were referred to your site from some source (search engine, link from another site, ad, etc.), but didn’t find what they were looking for. High bounce rates are bad.
In this report, you can see the website gets a moderate amount of traffic (1,220 users / 14 days = ~87 users p/day) from sources around the globe, but the bounce rate is pretty high (78.56%), over an average two week period.
Acquisition
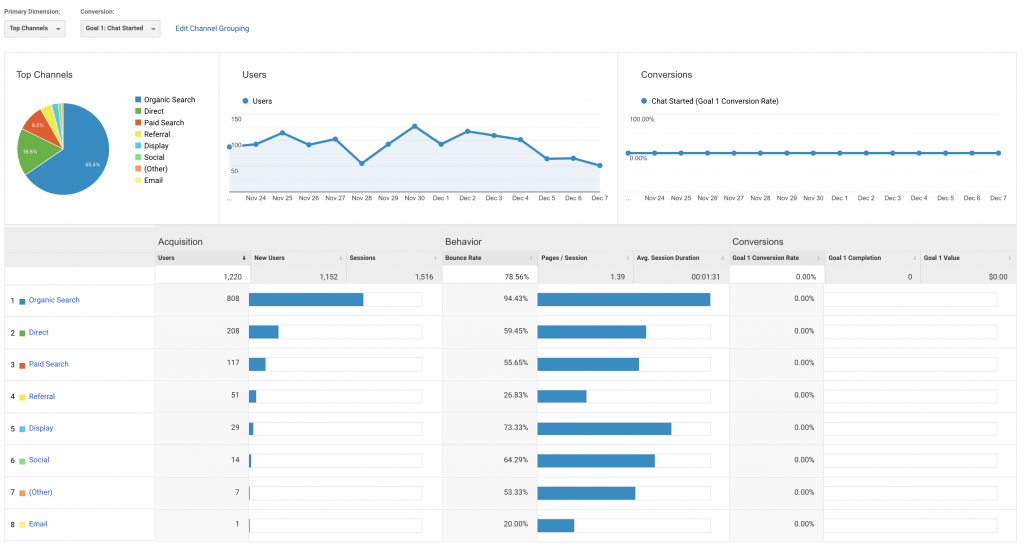
Acquisition metrics tell you where people came from, and allow you to understand by segment how their behavior differs. Visitors from organic search have the highest bounce rate, while those who came from a referral (a link from another site) have the lowest. Direct traffic (they typed your domain name into the browser) and paid search are showing a moderate bounce rate. These are great clues of how each segment engages with your content, and areas which need improvement (either through content changes, or changes to campaigns which drive traffic to the website). As you should expect better numbers/lower bounce rate percentage with referral visits, it’s ideal to aspire to reach those numbers through paid and organic search as well.
Although context of the data and looking beyond the bounce rates is key, it’s my experience, 75% and higher average bounce rate definitely needs improvement, a 50% average shows some engagement but leaves much room for improvement, 25% and under is doing pretty good, and getting below a 20% average bounce rate is excellent.
Behavior
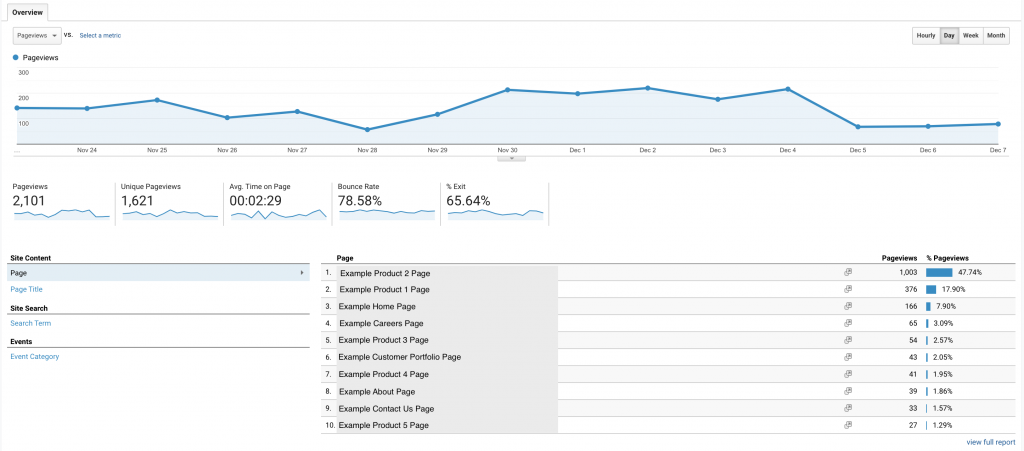
Behavior metrics tell you where visitors (as a whole) go on your website, including which page they landed on, other pages they may have visited, and which pages they exited on. This data hints at some of the most interesting aspects of your website traffic. The above screenshot is an overview example of the exit rate, and something notable is, over half the traffic to the site goes to one page (we’ve inserted generic web pages to protect the innocent), and exits (65.64%) after an average of 2.29 minutes. This could indicate this page doesn’t have call-to-actions which lure you over to other web pages and offerings, etc. In an ideal scenario, it would show increased traffic on several pages (verses favoring one), as well as a lower bounce rate and exit percentage.
On-Page Analytics

While basic analytics paints a picture of your web traffic, it doesn’t provide any “on page” analytics which explains what visitors actually do on the page. How are they engaging with the content on each page, at what point do they exit, and where are they going after they bounce? Leveraging tools like Crazy Egg or Hot Jar allow you to better understand this activity through heat maps, click maps, and screen recordings.
With this information, you can see if visitors are scrolling down your pages (and how far) and reading the content. You can see where they are clicking, including non-clickable content, and correlate other metrics like device type, referring site, and others to see how segments of your audience may have unique behavior patterns.
In this example, visitors were clicking on content that was not linked to another page (see orange and blue dots over the left side bullet points, which don’t link to other pages). This provides an indication of the visitors’ interest and intent, providing opportunities for improvement and personalization. With multiple dots over the Service menu at the top, you can also see that this was most clicked, again showing primary areas of interest. Not shown above is the decline in engagement the further down the page the user needs to scroll.
Phew! Congrats, You made it halfway through this data dive discourse!
We know you might be feeling a little overwhelmed at this point, but never fear, the Cloud Brigade team is here to assist your organization every step of this journey as needed. Please get in touch via email or schedule a brief meeting today!
Or, if you’re feeling brave, keep reading to understand more about optimizing your best sales tool…
Customer Journey Mapping
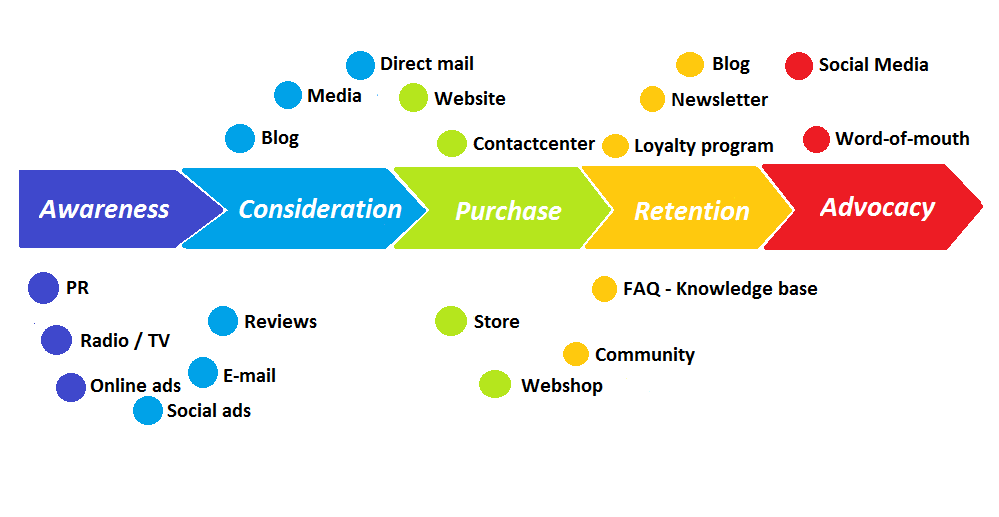
Understanding the journey your customer takes from first engagement to sale is critically important, and it’s rarely the result of a single visit. This journey is slightly different for different types of businesses, and the above infographic serves as a general example.
Customer journey mapping is used by most enterprise companies in order to find the secret recipe for success, and what triggered the conversion of a visitor to a customer. To accomplish this, we need to understand behavior on an individual level and to group visitors by these behaviors into something called customer segments.
No business has a single “persona” for all customers, and segmentation helps you to understand the behaviors of these groups of people far beyond basic demographic data. When you understand these segments, you can personalize your website content to provide a pathway for them.
Customer Journey Analytics
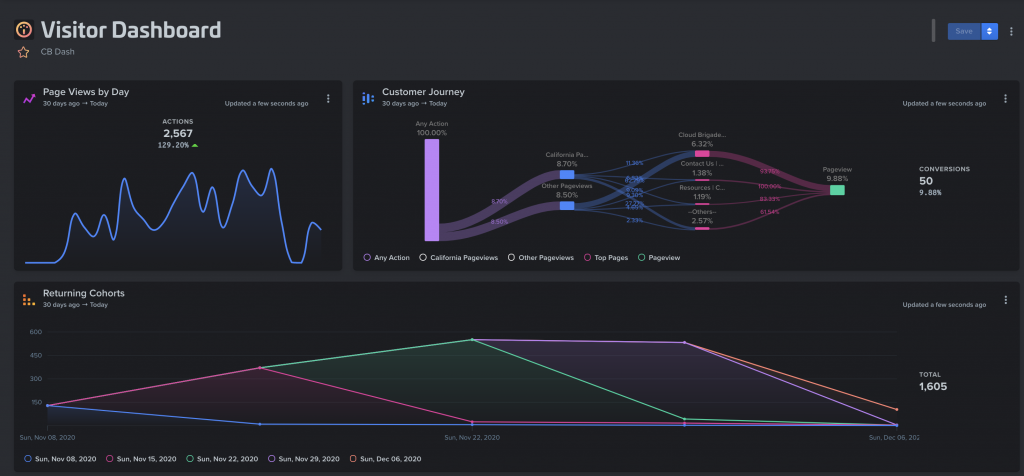
What if you could understand the customer journey by segment, as well as on an individual basis? Tools like Heap and Woopra provide the ability to collect data about your visitors and allow you to understand their journey. Visitors can be grouped into segments using a number of data points, including but not limited to how they got to your website, ad and email campaign parameters, and categorization of website content.
“For us, we use it every day to track user behavior, make changes and then watch the effect of those changes. Without Woopra we’d be guessing frankly.”
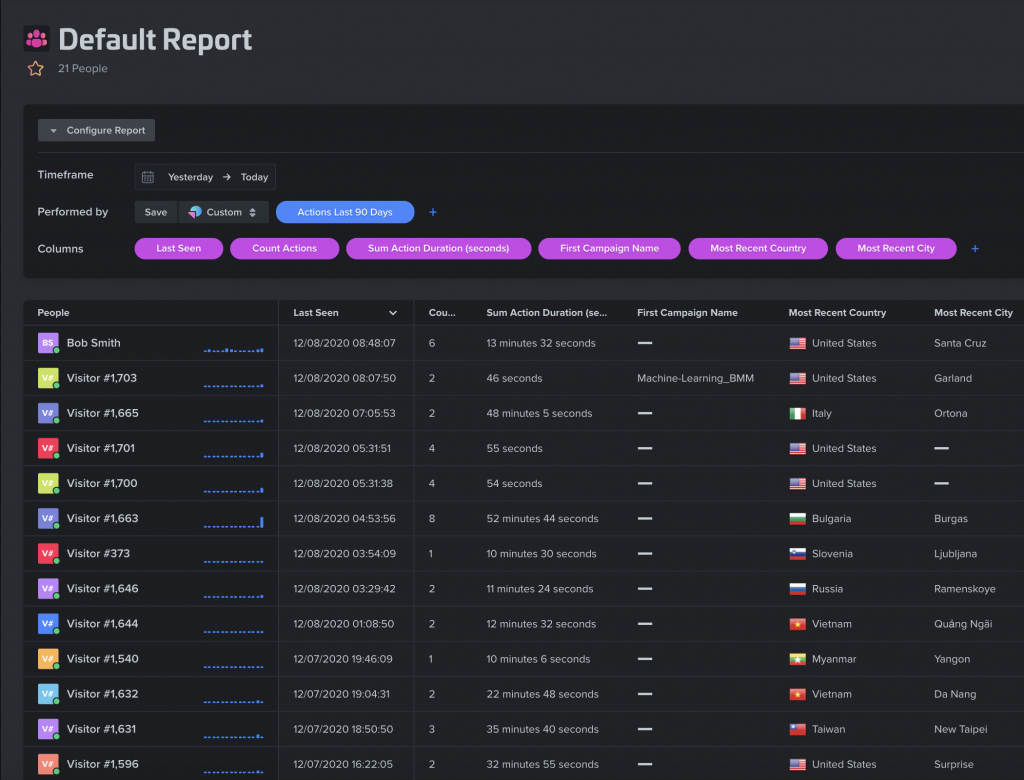
As you can see in the example above, the insight you can glean from this level of analytics is substantial. At a glance, we were able to filter down to users who took more than one action on the website, how long they spent, and where they came from. Who is Bob Smith you ask? He was identified through an interaction on our website, e.g., filling out a form, following a link from our newsletter, or manually updated during a review by marketing.
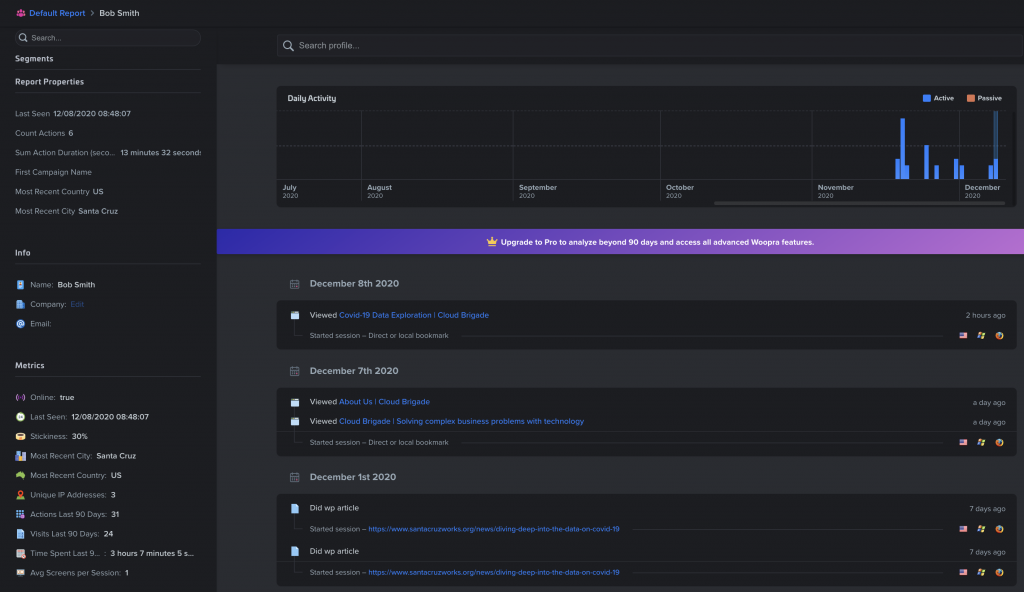
As we drill down into Bob’s journey, we can see when he visited our website, what content he viewed, and which devices/browsers were used (see icons to the right of the rows of information). The latter is important as content on the website is displayed differently between desktop, tablet, and mobile devices, and can indicate if content needs improved organization on different devices. We can further drill down into each visit and get additional information such as page-view times, content categories, and more.
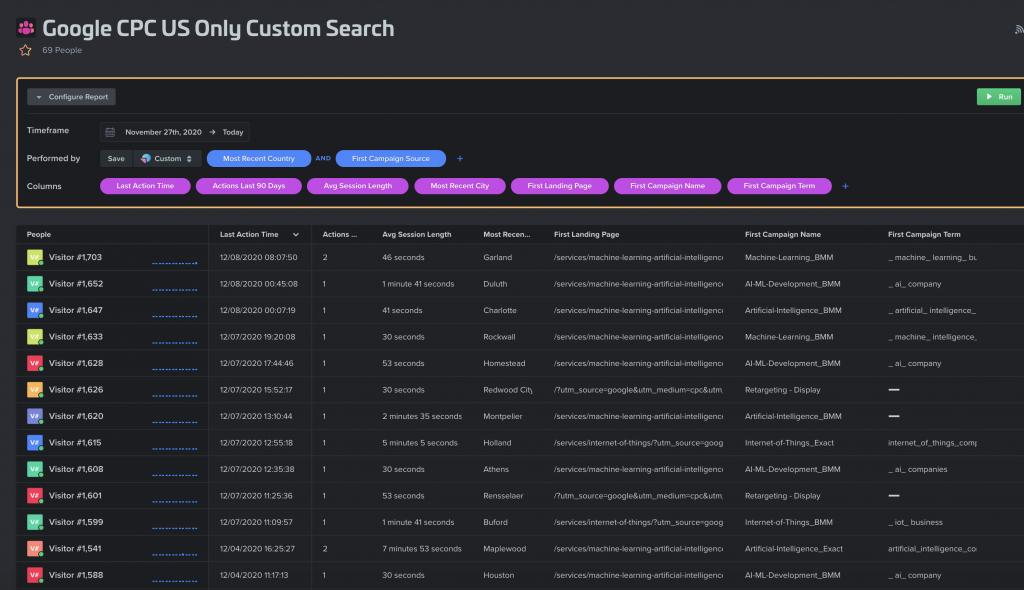
Taking this a step further, what if we want to dig into our online advertising campaigns? In this example, we observe our ad campaign traffic in the US segment, which campaign groups are driving traffic to the site, and what keyword groups were used to display the ads. These metrics along with others can be used to evaluate campaign parameters and results, as well as the need for content changes to better find audiences and align content with their interests.
Privacy
Of course, we need to address the gorilla in the room, and that’s privacy. Several consumer privacy laws have been enacted in the last few years, with the EU leading the way with GDPR, followed by California with CCPA. The privacy laws dictate how you manage your visitors’ data and even if you collect it at all.

Complying with these privacy laws involves adding privacy policies to your website, adding a privacy banner, and in some cases allowing the visitor to opt-in or opt-out of tracking. While this is a somewhat complex issue to navigate, we can assist with this by working with our legal and privacy partners to fit your specific needs, and it doesn’t need to be super painful.
Personalization
Taking all of this a step further, additional tools can be used to dynamically change and personalize the visitor experience, as well as experiment (or A/B test) with different content and tactics. The possibilities are many and include changing imagery, product offerings, custom popup messages, and related content. As an example, if your customer is interested in dog training, you probably don’t want to show them content about cat toys.
Getting Started
All of this information may be overwhelming, and that’s OK. If you aren’t ready to embrace all of this yet, the big takeaway is getting started with data collection. You can’t look at historical data if you are not collecting the data. Although many of these services have a monthly cost, most are not cost prohibitive and some have an entry-level tier. Adding analytics to your website now is a great investment, and when ready you can begin to investigate and peel back the layers to understand your visitors. The Cloud Brigade team is here to assist your organization every step of this journey as needed. Please get in touch via email or schedule a brief meeting today!
What’s Next
If you like what you read here, you might also be interested in the recent congressional interest in tech monopolies and how they made a wrong assumption about data. Relevancy outweighs quantity. Read the article here…
If you would like to follow our work, please signup for our newsletter.