Intro

Few businesses operate without a website these days, a necessary tool that allows your organization to connect with the world. The impact a website can have is often underestimated as many business leaders may have no idea what is really happening on their website. Vanity metrics like the number of visitors per month, bounce rate, and referral source don’t begin to tell the story.
Information is power as they say, and whether you want to just see ROI on your website investment, or leverage this asset as a growth catalyst, one must deeply and intimately understand how users find and engage with your website. Once limited to enterprise companies, deep marketing analytics are within reach of smaller organizations. In many cases, you just need a little help from a trusted partner.

Problem

Google Analytics has been the gold standard in basic website analytics, it’s free and provides a wealth of information. For all its power, lots of correlations are missing. The reasons are many and range from privacy concerns to pay-to-play analytics provided through other services like ads. New privacy laws also complicate this landscape.

The biggest problem we see is that _if_ the website owner has enabled Google Analytics, they rarely, if ever, look at it. Although the information is interesting and does provide some insights, understanding the information is not intuitive without knowledge around key metrics and indicators. Even worse, the metrics don’t provide any insight into what needs improvement.

How do I get more visitors to my website? What interests actually brought them here? Did they find what they are looking for? Did they even read our content, or just bounce to a competing website? These questions can’t be answered when the website is on auto-pilot.

Basic Analytics Explained

Before we dive into enhanced analytics, it’s important to have an understanding of the basics. If you are familiar with Google Analytics, you can skip to the next section. A few of the common metrics will give you a basic idea about the traffic coming to your website, we’ll explain these concepts below.

Audience

Audience metrics tell you how many users come to your website, how many are repeat visitors, for how long, and how much do they engage with your content. Bounce Rate is a key indicator, as a high bounce rate means that visitors, on average, weren’t engaging with your content. They looked at one or two pages, didn’t spend a lot of time, and “bounced.” It usually means they were referred to your site from some source (search engine, link from another site, ad, etc.), but didn’t find what they were looking for. High bounce rates are bad.

In this report, you can see the website gets a moderate amount of traffic (1,220 users / 14 days = ~87 users p/day) from sources around the globe, but the bounce rate is pretty high (78.56%), over an average two week period.

Acquisition

Acquisition metrics tell you where people came from, and allow you to understand by segment how their behavior differs. Visitors from organic search have the highest bounce rate, while those who came from a referral (a link from another site) have the lowest. Direct traffic (they typed your domain name into the browser) and paid search are showing a moderate bounce rate. These are great clues of how each segment engages with your content, and areas which need improvement (either through content changes, or changes to campaigns which drive traffic to the website). As you should expect better numbers/lower bounce rate percentage with referral visits, it’s ideal to aspire to reach those numbers through paid and organic search as well.

Although context of the data and looking beyond the bounce rates is key, it’s my experience, 75% and higher average bounce rate definitely needs improvement, a 50% average shows some engagement but leaves much room for improvement, 25% and under is doing pretty good, and getting below a 20% average bounce rate is excellent.

Behavior

Behavior metrics tell you where visitors (as a whole) go on your website, including which page they landed on, other pages they may have visited, and which pages they exited on. This data hints at some of the most interesting aspects of your website traffic. The above screenshot is an overview example of the exit rate, and something notable is, over half the traffic to the site goes to one page (we’ve inserted generic web pages to protect the innocent), and exits (65.64%) after an average of 2.29 minutes. This could indicate this page doesn’t have call-to-actions which lure you over to other web pages and offerings, etc. In an ideal scenario, it would show increased traffic on several pages (verses favoring one), as well as a lower bounce rate and exit percentage.

On-Page Analytics

While basic analytics paints a picture of your web traffic, it doesn’t provide any “on page” analytics which explains what visitors actually do on the page. How are they engaging with the content on each page, at what point do they exit, and where are they going after they bounce? Leveraging tools like Crazy Egg or Hot Jar allow you to better understand this activity through heat maps, click maps, and screen recordings.

With this information, you can see if visitors are scrolling down your pages (and how far) and reading the content. You can see where they are clicking, including non-clickable content, and correlate other metrics like device type, referring site, and others to see how segments of your audience may have unique behavior patterns.

In this example, visitors were clicking on content that was not linked to another page (see orange and blue dots over the left side bullet points, which don’t link to other pages). This provides an indication of the visitors’ interest and intent, providing opportunities for improvement and personalization. With multiple dots over the Service menu at the top, you can also see that this was most clicked, again showing primary areas of interest. Not shown above is the decline in engagement the further down the page the user needs to scroll.

Phew! Congrats, You made it halfway through this data dive discourse!

We know you might be feeling a little overwhelmed at this point, but never fear, the Cloud Brigade team is here to assist your organization every step of this journey as needed.  Please get in touch via email or schedule a brief meeting today!

Or, if you’re feeling brave, keep reading to understand more about optimizing your best sales tool…

Customer Journey Mapping

Understanding the journey your customer takes from first engagement to sale is critically important, and it’s rarely the result of a single visit. This journey is slightly different for different types of businesses, and the above infographic serves as a general example.

Customer journey mapping is used by most enterprise companies in order to find the secret recipe for success, and what triggered the conversion of a visitor to a customer. To accomplish this, we need to understand behavior on an individual level and to group visitors by these behaviors into something called customer segments.

No business has a single “persona” for all customers, and segmentation helps you to understand the behaviors of these groups of people far beyond basic demographic data. When you understand these segments, you can personalize your website content to provide a pathway for them.

Customer Journey Analytics

What if you could understand the customer journey by segment, as well as on an individual basis? Tools like Heap and Woopra provide the ability to collect data about your visitors and allow you to understand their journey. Visitors can be grouped into segments using a number of data points, including but not limited to how they got to your website, ad and email campaign parameters, and categorization of website content.

“For us, we use it every day to track user behavior, make changes and then watch the effect of those changes. Without Woopra we’d be guessing frankly.”

As you can see in the example above, the insight you can glean from this level of analytics is substantial. At a glance, we were able to filter down to users who took more than one action on the website, how long they spent, and where they came from. Who is Bob Smith you ask? He was identified through an interaction on our website, e.g., filling out a form, following a link from our newsletter, or manually updated during a review by marketing.

As we drill down into Bob’s journey, we can see when he visited our website, what content he viewed, and which devices/browsers were used (see icons to the right of the rows of information). The latter is important as content on the website is displayed differently between desktop, tablet, and mobile devices, and can indicate if content needs improved organization on different devices. We can further drill down into each visit and get additional information such as page-view times, content categories, and more.

Taking this a step further, what if we want to dig into our online advertising campaigns? In this example, we observe our ad campaign traffic in the US segment, which campaign groups are driving traffic to the site, and what keyword groups were used to display the ads. These metrics along with others can be used to evaluate campaign parameters and results, as well as the need for content changes to better find audiences and align content with their interests.

Privacy

Of course, we need to address the gorilla in the room, and that’s privacy. Several consumer privacy laws have been enacted in the last few years, with the EU leading the way with GDPR, followed by California with CCPA. The privacy laws dictate how you manage your visitors’ data and even if you collect it at all.

Complying with these privacy laws involves adding privacy policies to your website, adding a privacy banner, and in some cases allowing the visitor to opt-in or opt-out of tracking. While this is a somewhat complex issue to navigate, we can assist with this by working with our legal and privacy partners to fit your specific needs, and it doesn’t need to be super painful.

Personalization

Taking all of this a step further, additional tools can be used to dynamically change and personalize the visitor experience, as well as experiment (or A/B test) with different content and tactics. The possibilities are many and include changing imagery, product offerings, custom popup messages, and related content. As an example, if your customer is interested in dog training, you probably don’t want to show them content about cat toys.

Getting Started

All of this information may be overwhelming, and that’s OK. If you aren’t ready to embrace all of this yet, the big takeaway is getting started with data collection. You can’t look at historical data if you are not collecting the data. Although many of these services have a monthly cost, most are not cost prohibitive and some have an entry-level tier. Adding analytics to your website now is a great investment, and when ready you can begin to investigate and peel back the layers to understand your visitors. The Cloud Brigade team is here to assist your organization every step of this journey as needed.  Please get in touch via email or schedule a brief meeting today!

What’s Next

If you like what you read here, you might also be interested in the recent congressional interest in tech monopolies and how they made a wrong assumption about data. Relevancy outweighs quantity. Read the article here…

If you would like to follow our work, please signup for our newsletter.

Background

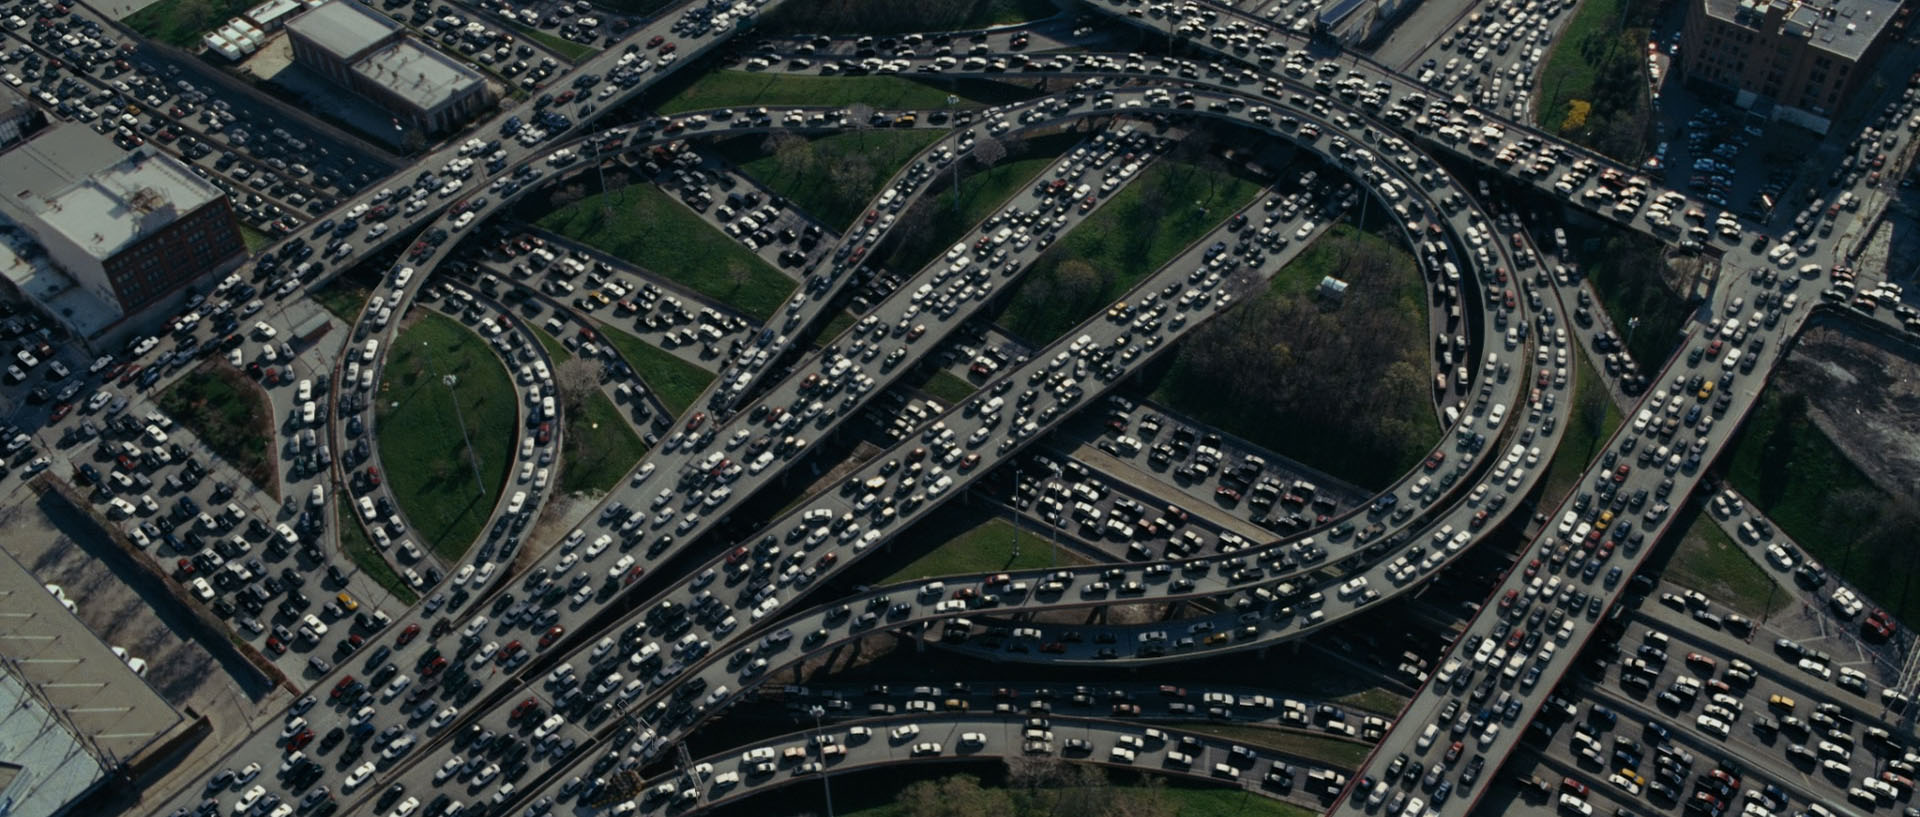
Ever wonder why it takes a half-hour or more to travel 2.5 miles on Mission Street on the West Side in Santa Cruz, California? The traffic lights only seem to laugh as you watch them cycle through from green to red without putting your car into gear. The Cloud Brigade team knew using a Machine Learning solution would deliver a better way to streamline the flow of traffic.

Challenge

Cities all over America are experiencing road congestion at a growing rate each year, and the traffic light systems run on either timers or sensors. Neither of these systems are responsive to dynamic traffic conditions. Cloud Brigade wanted to use Machine Learning technology to maximize throughput while minimizing wait times of entire intersection traffic light systems, in real time.

Benefits

  • Reduced traffic congestion
  • Provides time for Traffic Engineers to be more proactive by eliminating the need for their constant attention to traffic signal patterns
  • Reduction in payroll budget yields increased programs and equipment budget
  • Future-proof and scalable
  • Better reliability

Business Challenges

  • Irresolvable Complexity – Simply turning all the lights green at the same time on Mission Street ignores the traffic crossing or entering from the side streets
  • Inefficient Systems/Processes – It should not take so long to get to the grocery store or home from work to see your family–this is a 4-lane road in a city of 65K 
  • Skills & Staffing Gaps – It really doesn’t make monetary sense for the city to hire on a set of full-time Software and Traffic Engineers to solve this one problem  
  • Antiquated Technology – Using Traffic Signal Light (TSL) timers or metal/motion sensors at the intersections only exacerbates the existing congestion, especially during tourist seasons

Solution and Strategy

Cloud Brigade had already started looking at ways to use Computer Vision and a Reinforcement Learning model in tandem when it built its front-lawn defender, the Poopinator. Cloud Brigade had proven it could think outside the box on complex projects and brought its “A team” to lead the development and design of an end-to-end IoT product that runs multiple AI models to control the traffic light signals and respond to changes in real time, alleviating traffic wait times by reducing queueing and maximizing throughput.

The Locals Were Getting Restless

For years, Mission Street has become a bogged-down, carbon-monoxide-producing, loud-exhaust harboring nightmare for anyone trying to leave town north on route 1, or just get to the grocery store. The current technology that runs traffic regulation, Traffic Signal Lights (TSL’s), is antiquated and to hire engineers and work crews to overhaul the whole system involves excessive operational costs at the local level. The Cloud Brigade team knew there was a better economical, scalable and reliable way.

This Was No Ordinary Project

Chris Miller, founder and CEO of Cloud Brigade, has been a Machine Learning guru for a few years now. Machine Learning is the process of building mathematical and software models that help a computer “learn” how to complete a task, and Computer Vision applies Machine Learning techniques to camera images. In the winter of 2019-2020, Chris found himself again waiting tool long on Mission Street. Talking about his process, he explains “All these cars are just backed up from Bay Street, and it just doesn’t make sense. There has to be a better way to streamline the flow of traffic.”

Where it Began

He got the spark of interest in the traffic control problem from an RFP that the city of San Jose, California issued in 2019. They wanted to update all of their traffic lights from the current system. As Chris explains, updating the timing settings or sensor settings on a single intersection currently requires sending an entire team into the field to observe over many days, and then making changes and adjustments that might only be relevant for a specific time of year or time of day. He explains that the “[current] systems are not dynamic in terms of responding to traffic in real time.” Although he didn’t end up bidding on the San Jose project, Chris contacted Amazon in his exploration process and discovered the AWS DeepLens camera as a starting point in the Machine Learning solution.

Smarty-Pants Technology

The AWS DeepLens camera is essentially a computer within a video camera. As an IoT (internet of things) device with a Machine Learning edge, Amazon’s DeepLens camera can deploy a computer vision model in real time. What does this mean? This means that the camera can be mounted in an intersection, can watch the traffic roll by, and without a human watching any footage, the camera can catalogue the number of vehicles entering and exiting the intersection, can discern how many of those vehicles are cars, trucks, buses, motorcycles, bicycles, human pedestrians, or tractor-trailers (or scooters, Segways, train-trolleys…I could keep going).  Using a Machine Learning model that is deployed on the DeepLens camera’s microprocessor, it can not only “see” what is happening, it can also detect the direction the vehicles are moving, what speed they are going, if they are turning or not, and even when there are traffic accidents. Pretty cool, huh?

The data processing does take up a lot of personnel time and energy, and deploying multiple models to constantly run on the AWS DeepLens alone does get a bit space prohibitive, but our local Machine Learning engineer, Mark Davidson was happy to lend a hand. Using a Raspberry Pi, a small computer that can be adapted for many tasks including IoT projects, Mark was able to create a way to run the models in the field and upload the observations to the cloud.

How does this observation engine help us to make our traffic flow more smoothly? The answer is, this is only the first step. The majority of traffic lights in the United States are run on either a timer system, cycling through a certain number of seconds before switching the lights from green to red, or on a motion-sensor system, detecting the presence of traffic entering a waiting queue. This technology suits us fine in low-traffic situations, but leads to bottle-necking in heavy traffic times, as explained in queueing theory.

What is Queueing Theory?

Queueing Theory, or the study of congestion and waiting in line, suggests that the complete absence of waiting in line is the symptom of a system that is too big for its demand, but that bottle-necking arises when the amount of vehicles coming into the system is too much for the system to handle. If this is a constant problem, then you need to increase the throughput to allow for the smoothest possible flow of traffic through the system. This can be done by building a larger system (adding a subway train, or maybe a vehicle road in the sky above the current road?), or by increasing the efficiency of the system regulation (traffic lights).

So, if all of our traffic signals are governed by old technology that either run timers or switch modes on a sensor, the bottle-necking that we see during rush hour—or during all daylight hours during the busy tourist seasons—will be too much for that technology to optimize. It is clear that revamping this system using that old technology will result in prohibitively excessive operational costs. This is where our second Machine Learning model comes in.

Building the Reinforcement Learning (RL) Model

You train a Reinforcement Learning (RL) Model to do its job by rewarding it with points when it does a good job, kind of like giving your dog a bone (positive reinforcement). Your dog can’t understand (much) abstract thought, but it understands a piece of bacon. In this case, the bacon is a numeric point system, and we reward the model when the number of vehicles waiting at a red light is low. We also reward the model when the throughput, or total number of vehicles that run through the whole system is high. Since the rewards are multi-faceted, the model has to keep adjusting itself to find that sweet spot, and every time it takes an action and sees its reward or lack thereof, the model learns a little more and gets a little better.

Robert Sato, Masters in Computer Science Candidate, UCSC

This new Machine Learning technology will control for optimum traffic throughput while also minimizing the wait times of all travelers, may they be on Mission Street or on any of the cross-streets that intersect with Mission. For this, Cloud Brigade’s internship program brought in UCSC Masters in Computer Science candidate Robert Sato during the summer of 2020. Robert describes himself as a person who is “interested in everything and anything related to Machine Learning and quantum computing,” and so he was quite eager to employ his Python skills and to design our version of the model that I described above.

Technical Hurdles to Overcome

Robert mentioned “understanding Amazon’s software“ as his tallest hurdle. “While there are many example notebooks and decent documentation, the Amazon environment is so vast that it took a lot of time and effort to familiarize myself with building out the project in the Amazon environment.” Still, he found using the AWS cloud infrastructure to be essential to connecting his RL Model to the virtual testing environment where his model would perform its training. “[Amazon] offered many well packaged services that were easy to use and bring together such as SageMaker, EC2 and Lambda…the many Amazon RL example notebooks, [had] a clear, consistent framework that I was able to apply to this project.”

https://www.fxguide.com/wp-content/uploads/2011/04/Modus_SourceCode_trafficjam-highway_vfx.jpg

Vision Journey

When Chris had planned out the project back in February 2020, he’d envisioned creating a virtual world where he could feed in real world data using traffic information collected by the AWS Camera. This virtual world would be a place where the RL Model could learn the most efficient way to direct traffic. Robert found that he could use the AWS cloud infrastructure in concert with some existing traffic control software and a Python library.

Robert used Python’s Gym library to interact with a simulation program called SUMO, or the Simulation of Urban Mobility program (built by German Aerospace Center and initially released in 2001). Through research, a lot of mathematics, software engineering and trial and error, Robert was able to use SUMO to create a simulation of traffic entering and exiting an intersection and to then use that simulation’s data against his RL Model. Chris’s plan was finally nearly complete.

Simulation of RL Model

A Successful Integration and a Technology Handoff

One thing we have learned through our work in Machine Learning is just how time consuming and intricate each step can be. A lot of times, the work of building up the infrastructure and lining up the data so that the different parts can all communicate with each other are actually more challenging than creating and using Artificial Intelligence. In this case, Robert was able to build out this model and its simulation environment in a way that we can deploy it to the AWS cloud infrastructure where the model can receive traffic data from the AWS DeepLens camera and in turn send its signal response out to the traffic lights in real time.

The final step will be to package the two Machine Learning models, the AWS DeepLens Camera, the AWS Cloud Computing instance, and the IoT traffic signal control product as a single end-to-end AI device that utilizes a Raspberry Pi and the AWS cloud infrastructure to respond to live changes in real time. 

Download the full story here.

Opportunities

While this project is designed to fix our traffic problems where we live and work, it is not a niche product.  From a one stop-light town to a complex traffic light system regulating large city surface streets, it can be scaled out easily. We look forward to the final product being useful in cities of every size all across the country. This is the perfect system for a small town that only sees an influx in traffic a few times a day, a large city that is in constant strain, or a medium sized city that is constantly wondering where all the traffic is coming from in the first place. We’re excited to take the next steps and can’t wait to show more photos and videos of the process.

What’s Next

If you like what you read here, the Cloud Brigade team offers expert Machine Learning as well as Big Data services to help your organization with its insights. We look forward to hearing from you.

Please reach out to us using our Contact Form with any questions.

If you would like to follow our work, please signup for our newsletter.

When Amazon Web Services (AWS) found out about The Poopinator project, they said they wanted to do a video about it. Wait, what? Yep, that’s what we thought too.

Due to Covid we even got to shoot some footage selfie-style, but they did such an excellent job you’d never know it. We’re honored to have had the opportunity to be featured in the upcoming series #AWSInnovators.

You can read more about The Poopinator in our blog post.

Our CEO was also invited to participate in the private beta of AWS Community Builders last year, a community of innovators with a love of tech, mentoring, and knowledge sharing. Read the story here.

What’s Next

If you like what you read here, the Cloud Brigade team offers expert Machine Learning as well as Big Data services to help your organization with its insights. We look forward to hearing from you.

Please reach out to us using our Contact Form with any questions.

If you would like to follow our work, please signup for our newsletter.

by David Apgar, Santa Cruz County Bank

Underlying the recent congressional interest in tech monopolies is a wrong assumption about data. Lucrative monopolies are supposedly inevitable in lines of business that depend on data because companies become more effective as they accumulate more of the stuff. Whoever has the most data wins. And it’s not just excitable members of Congress. To get the attention of investors, tech entrepreneurs learn early they must promise to pursue winner-takes-all strategies. Except it’s just not true that effective data strategies are always, or even usually, winner-takes-all. In fact, most are not.

Public interest in tech monopolies is rising partly because researchers no longer think market power like Facebook’s in targeted advertising is benign. Britain’s Competition and Markets Authority, for example, estimates digital advertising costs households $650 per year, and Congress is exploring easier ways to reign in firms that abuse monopoly power, such as reallocating a majority of their board seats to labor and public interest representatives, stripping owners of their controlling interest.

Tech leaders have consequently become more circumspect in defending the market power of their firms since Peter Thiel told a Stanford audience in 2014 that competition is for losers. Not only do network effects supposedly lead to natural monopolies that benefit consumers who flock to the provider with the most customers, but machine learning arguably does so as well because more data – in the form of examples and indicators characterizing them – let the machines that learn draw better conclusions about new examples. Whether machine learning predicts sales probabilities, smooth paths down a highway, or the best way to end a sentence, whichever company has the most data to train its machine will provide the best service. You may as well become a customer and add your data to the biggest pile. Don’t blame tech leaders for monopolies, blame data.

If there are enough situations where winning data strategies do not depend on volume, though, the argument falls apart and we should not expect tech monopolies to become inevitable or pervasive – just very sweet deals for investors. The most important examples are strategies based on data relevance rather than data volume that leave room for competitors to offer services based on data that are relevant in different ways. In businesses where data relevance counts as much as data volume, rolling up your sleeves and pursuing a competitive data strategy won’t doom your startup to the mediocrity of Peter Thiel’s losers. LinkedIn and Netflix both pursued competitive data strategies based on relevance rather than volume, for example, that nevertheless proved critical to success.

You might not think LinkedIn founder Reid Hoffman, who coauthored Blitzscaling, ever deviated from pursuing monopolies. Long before Microsoft acquired it, however, LinkedIn had a plan to build a trusted network. Like an early blockchain, the professional network would let members vouch for their contacts, connecting people who had never met through chains of trust.

However advantageous size might be to members of such a network, there’s little about it that excluded rivals. Vouching for contacts was real work – few paid for the privilege. In the end, the trusted network died on its own vines, leaving a valuable recruiting tool growing out of its roots for which Microsoft was willing to pay $26 billion. Far from making LinkedIn a loser, its early competitive data strategy led to an innovative tool for deploying the data you consider relevant to advancing your own career. Size helps LinkedIn more these days, but plenty of specialized recruiting networks grow comfortably alongside.

While Netflix founder and CEO Reed Hastings did appear in one of Reid Hoffman’s Masters of Scale podcasts, he embraced competitive business models from the start. Even the introduction of its original Cinematch recommendation engine – arguably the streaming service’s stickiest feature – had little to do with discouraging Netflix users from switching to rivals. In fact, the original purpose of Cinematch was to manage the company’s inventory of physical DVDs. By recommending lesser-known films that users enjoyed, Netflix spread demand away from current hits and avoided DVD stockouts. The company actually deemphasized recommendations when it introduced streaming in 2007.

What started as an inventory management tactic nevertheless became a distinguishing feature of Netflix, leading it into the even more competitive business of developing original content. Like LinkedIn, Netflix lets users deploy information relevant to a specific challenge – in this case, finding new films you’ll like. It helps that Netflix recommendations factor in the preferences of lots of other viewers, but that’s not as important as each user’s own history with the company.

Far from dampening innovation, the early strategies of LinkedIn and Netflix that embraced competition gave innovation a push. Pursuing strategies based on data relevance rather than volume may not have made them monopolies. But by tailoring their data strategies to the problems they needed to solve, they transformed professional recruiting and online entertainment.

On their own, of course, these examples might be flukes. There’s a theoretical reason, however, to think they illustrate a general limit to the value of scale in data businesses. The foundational work of Thomas Bayes on probabilistic inference in the 1760s and Claude Shannon on communication theory in the 1940s both show the information a set of data provides about a variable of interest always depends on two quantifiable things: the size of the data set and how strongly outcomes of the variable determine outcomes in the data set. As it turns out, this second thing – how strongly outcomes of an unknown variable of interest determine the outcomes of a data set – gives a precise measure of the relevance of the data to the variable. Relevance and volume thus jointly fix the value of a company’s data resources.

Strategies based on data relevance that embrace competition thus always have the potential to challenge winner-takes-all strategies based on data volume – a heresy against faith in tech monopolies that used to be confined to data-science classrooms. COVID-19, however, has changed that because lots of worried parents and health workers have suddenly taken a crash course in the difference between viral tests and antibody tests.

A major use of antibody tests is determining whether health workers have immunity to a disease before sending them into wards where they would otherwise run a high risk of catching it. These tests need to avoid false positives that might lead a doctor to think she had immune protection she actually lacked. Epidemiologists say tests that successfully avoid false positives have high specificity, never confusing a common-cold antibody, for example, with one for the novel coronavirus.

The principal use of viral tests, in contrast, is to help health workers contain outbreaks. These tests must avoid false negatives that might lead a team to miss a major source of contagion. They have to be highly sensitive to the bug in question. Indeed, sensitivity is the term epidemiologists use for the ability of a test to avoid false negatives. In general, different tests are sensitive to different viruses.

This trips up apologists for tech monopolies because there’s a close parallel between software systems that analyze data and epidemiological tests. Software systems that must make fine distinctions like antibody tests gain their specificity through large data sets. In both cases, diagnostic systems backed by more data are better, while oversensitivity can be a danger. Software systems that must detect faint signals like viral tests rely on data strictly determined by those signals as opposed to large amounts of data. The specificity that winner-takes-all strategies can achieve is beside the point. What matters is the sensitivity of the test and the relevance of the data behind it.

Insisting big data sets solve everything better is like saying we need only antibody tests in a pandemic. It ignores the role of sensitive tests that avoid false negatives, like those for detecting individual viruses, where big data sets are superfluous and there are no winner-takes-all strategies.

COVID-19 has given us one other reason to doubt whether more data is always better. There are practical tradeoffs between the specificity and sensitivity of the health tests we can construct. In fact, it’s true of all diagnostic systems. Big data sets – like high-specificity tests – will generally sacrifice sensitivity in practice. The intuition here is that software systems able to make fine distinctions backed by a lot of data avoid mixing up situations that are only similar to one another. To do that, they can’t be oversensitive to situations that resemble one another in ways that may be essential.

For example, imagine your online sales system uses a massive database to customize product offers based on exactly where customers click and in what order. And let’s say it successfully discriminates among dozens of types of customers – high specificity. The trouble is a key customer may get entirely different offers if she visits the site twice. A system sensitive to key customers won’t make that mistake.

In short, applications backed by lots of data that can avoid false positives will probably generate false negatives. For plenty of commercial and social purposes, however, false negatives are the problem. LinkedIn users want to avoid the false negative of a recruiter failing to see they have the perfect skills for a job, for example. And Netflix users hope the streaming service won’t fail to find their future favorite film. In cases like these, data strategies need not be winner-takes-all – in fact, better if they’re not.

Most effective data strategies are not winner-takes-all because data does not add up in a simple way to insights. Even so, investors will always have an incentive to push data entrepreneurs to build monopolies. To be true to the data challenges they tackle, the next generation of entrepreneurs will often just have to say no.

[The author wishes to thank Stephen Beitzel for contributing to this article, and especially to the discussion of LinkedIn and Netflix.]

What’s Next

If you like what you read here, the Cloud Brigade team offers expert Machine Learning as well as Big Data services to help your organization with its insights. We look forward to hearing from you.

Please reach out to us using our Contact Form with any questions.

If you would like to follow our work, please signup for our newsletter.

Nordic Naturals Captures Chinese Consumer Business

www.nordicnaturals.com

Summary

  • Customer Since 2016
  • Global, HQ in Watsonville, CA, USA
  • Healthcare, Midsize Enterprise
  • Joar Opheim, Founder and CEO
  • Founded in 1995, Privately Held

Challenge

Need to expand and create a full e-commerce website and develop all the necessary processes and logistical infrastructure to accept customer orders and Chinese payments and to deliver product to consumers in-country.

Custom E-commerce Website Developed by Cloud Brigade

Benefits

  • Enabled business expansion to China
  • Reduced shipping expenses and simplified e-commerce workflow platforms
  • Solved restrictions related to digital payments acceptance, product taxation and purchase limits
  • Integrated and automated data systems and processes
  • Enabled long-term security contingency plans
  • Implemented replicable global technology solution and e-commerce strategy

About Nordic Naturals, Inc.

Since its founding in 1995, Nordic Naturals has been setting standards for omega-3 excellence. It is the #1 Fish Oil brand in the U.S. in the natural products sector. More than 25 years later, Nordic Naturals offers 200+ products for customers around the world. With products for the whole family, the company delivers the supplemental nutrients essential for healthy living.

Nordic Naturals is headquartered in Watsonville, CA, United States, with manufacturing facilities in Arctic Norway.

Background

Nordic Naturals wanted to expand consumer product sales into mainland China. The company had a Chinese-language marketing website to display its offerings, but it wasn’t set up to allow e-commerce. The company’s internal web development team lacked sufficient staff to handle the development needs, which included complex integrations with their e-commerce platform and their enterprise resource planning (ERP) system. Nothing about this project would be “cookie cutter” simple.

The Challenges

  • Irresolvable Complexity – Convoluted Chinese regulations required development of unique processes.
  • Inefficient Systems and Processes – Employees were manually entering customer orders from emails into the ERP system.
  • Skills and Staffing Gaps – They had not yet built out their internal development team, prompting Cloud Brigade to fill the gap.
  • Antiquated Technology – The original e-commerce website was 20 years old and dying under its own weight.

The Solution

Cloud Brigade had already engaged on a prior assignment with Nordic Naturals as a trusted advisor to consult on the overhaul of the company’s main website. Cloud Brigade had proven it could think outside the box on complex projects and brought its “A team” to lead the development and integration efforts to build the Chinese e-commerce site.

The Vast Chinese Consumer Market Awaits

Nordic Naturals felt the time was right to sell direct to consumers in mainland China. The company already had a static Chinese-language marketing website but it didn’t support transactions of any sort. The challenge was to create a full e-commerce website and develop all the necessary processes and logistical infrastructure to accept customer orders and Chinese payments and to deliver product to consumers in-country. The complexity of this challenge can’t be overstated; outside the box thinking was as critical as the technical knowledge and skills to tackle the project.

Cloud Brigade had previously done some website consulting for Nordic Naturals. IT Director Mark Timares felt Chris Miller and his team at Cloud Brigade were the right people for the Chinese website project. “We knew we could count on the responsiveness, reliability, and technical prowess of the Cloud Brigade team,” says Timares. “They are very good at sifting through technical issues and explaining and then solving them.”

“A project like this can get very complicated and we needed expert help. Chris has always been able to get to the core issues with a consultative advocacy perspective that is very helpful.”

– Mark Timares, IT Director

This Was No Ordinary Project

Chris Miller, CEO, Cloud Brigade, outlines the long list of challenges the team had to overcome to make not just the e-commerce website, but the entire end-to-end commerce process, workable for Chinese consumers. “Doing business in China is nothing like selling to consumers in the EU or the United States,” says Miller. “There are so many business as well as technical issues that have to be worked out. For example, how to ship products to China, and how to accept digital payments from customers ordering their fish oil and vitamins. It’s well known that China puts a lot of restrictions on its citizens, and every restriction is an obstacle we had to work through.”

Nordic Naturals was already using an e-commerce platform called Magento. The original marketing website was on an old version of Magento. The Cloud Brigade team was tasked with developing the new e-commerce website on an updated version of Magento. “Business requirements dictated that we work with third party vendors on a lot of logistical issues. Unfortunately, there were no off-the-shelf integrations with Magento, so we had to develop them ourselves,” says Miller. He cites a non-standard method of product taxation in China, and limits on how much a person could purchase in a particular order. They also had to work with shipping companies that need to collect a government-issued ID from each consumer and incorporate that shipping process into the e-commerce workflow. Cloud Brigade had to create integrations for Magento that managed the complex purchase processes.

Another step was to integrate with Nordic Naturals’ ERP system, xTuple, which controls the production process. The old process involved people manually entering Chinese orders into xTuple that had come in through email. Not only was this totally inefficient but it was also a potential source of human error. Cloud Brigade would need to create an integration between Magento and xTuple for automated data interchange. The ERP vendor provided an API for custom integrations, but it was fairly new and sparsely documented at the time. Cloud Brigade worked with xTuple directly to build out and test this custom integration to ensure it works well.

The integration with xTuple handles fulfillment, and it also facilitates the shipping process to send product to China. Because shipping to China is expensive, the orders need to be accumulated and shipped in batches. Further complicating this process is the need to ship some orders to Hong Kong and hold them for later delivery to China if the government-issued ID information is missing from the original order. All of these kinds of considerations had to be programmed into the applications built by Cloud Brigade.

Technical Hurdles to Overcome

Cloud Brigade faced a fair number of technical hurdles with this project. One is dubbed The Great Firewall of China. At any given time, the Chinese government can block communications going into or coming out of the country. Cloud Brigade had to take this into consideration because one of the servers used to support Nordic Naturals’ website is located behind this firewall. Miller acknowledged that this important resource could be unavailable from time to time. “It got me thinking about always having a contingency plan and making the assumption that there are things outside of our control that can be broken at any time,” says Miller. “I remind our technicians to think about this whenever they’re doing any kind of system engineering.”

The xTuple integration was quite a technical challenge as well. Miller says they worked with xTuple’s technical team to deal with some nuances of the API in order to align with the ERP processes. Cloud Brigade also had to patch some Google contributed code to get around other implementation issues with the API. In addition, the xTuple system is an on-premise system, meaning it operates behind a firewall in the Watsonville facility. “We had to do some special coding to get around the fact that the xTuple application was not designed to be run behind the firewall that way,” says Miller. But he adds that these are the kinds of challenges that make the work fun. “Our team loves to take a technical roadblock and turn it into a nice smooth highway.”

“All of Cloud Brigade’s projects for Nordic Naturals have been very successful. The technology works, it was delivered on time and on budget, and the responsiveness from their team was excellent. We got what we asked for and there is a reliability that we can count on from Cloud Brigade which is the most important thing in a relationship.”

– Mark Timares, IT Director

A Successful Launch and a Technology Handoff

“We were able to get their system launched and Nordic Naturals was able to start doing commerce inside mainland China,” says Miller. “Afterward, they hired a large company to do a complete multi-country Magneto site, and we worked with that vendor to do a technology handoff so they could benefit from all of Cloud Brigade’s work. They were able to take all our code and port it over to the new implementation, so everything was reusable.”

“Chris and the team at Cloud Brigade helped us build our business in China and then provided advisory services to us as we charted a plan technically to move forward more broadly with our e-commerce strategy,” says Timares. “His team was very professional and responsive and their ability to jump on an issue and get it resolved was paramount to our success.”

Download the full story here.

It seems we can’t find what you’re looking for. Perhaps searching can help.