The AWS DeepRacer platform brilliantly made Machine Learning approachable by gamifying the learning process. DeepRacer is a 1/18th scale autonomous racing car with an onboard computer, camera, and a growing list of sensors such as Lidar and stereoscopic vision. Introduced at the AWS re:Invent 2018 conference, the official DeepRacer league has over 1500 members across the globe.
The Santa Cruz DeepRacer meetup group was started by a 2019 DeepRacer League winner from Santa Cruz (Chris Miller from Launch Brigade / Cloud Brigade). With a growing number of Central Coast locals interested in Machine Learning, the purpose of this meetup group is to build a community and explore the DeepRacer platform further. Events will include tutorials, knowledge sharing, and racing events on real tracks with the DeepRacer car.
To sign up for the Santa Cruz DeepRacer Meetup Group click here
Watch the KSQD interview with Chris Miller to find out more.
What’s Next
If you like what you read here, the Cloud Brigade team offers expert Machine Learning as well as Big Data services to help your organization with its insights. We look forward to hearing from you.
Please reach out to us using our Contact Form with any questions.
If you would like to follow our work, please signup for our newsletter.
The Problem
It’s an increasingly common modern workplace problem. With hybrid work arrangements (those which allow workers to telecommute part time), many companies are grappling with how to manage their office space and capacity. We were approached by one of our clients with this exact problem. With an expensive office in San Francisco’s Financial District, they need to intelligently manage their available space to accommodate a rotating cast of employees.
As a large global non-profit, the organization has a complex org chart with many teams and departments. The office, an entire floor near the top of a skyscraper, is configured with a mix of dedicated desks, roaming seats, and shared conference rooms much like a coworking facility. The building is secured with RFID badges which restrict elevator and floor access as well as office entry.
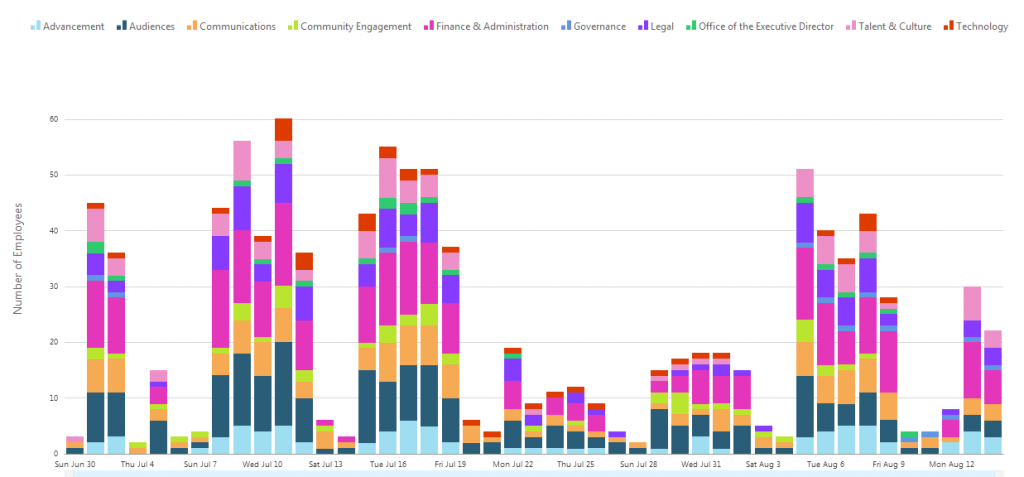
Cloud Brigade was tasked with providing a web based graphical tool to measure office usage and to provide for capacity planning. Expanding into additional space inside the building was going to be expensive, not just in lease costs, but the entire planning and improvement process. Our client needed to understand how the existing office space was being used, including :
Total headcount per day
Peak usage days
Break down by department and team
Conference room usage
Finding Clues with Data
Looking at the available sources, gaining access to the Brivo RFID card reader data was an obvious first step. Unfortunately with large elevator capacity, we were only capturing the first employee through the door. How then do you go about determining if an employee is actually in the building?
Next we looked at Google Suite data which tracks the logins of every employee and the public facing IP address. In this case Google provides a default session expiration time of 30 days. Although employees often authenticated more often than that, this simply wasn’t going to give us the granular data we needed.
Many employees with hybrid work arrangements use laptops, and those laptops connect to the internet using wifi. We were able to detect the presence of devices by their MAC address, a unique ID embedded into every device by the networking chip. Because our client also used Oomnitza, a digital asset tracking software, we were able to map company owned devices to an employee name. It was progress, but it still didn’t provide the level of accuracy we wanted.
The Meraki wifi network used a centralized authentication system based on LDAP, providing per-person access to resources, security, and efficient on/off-boarding of employees. Because each wifi user’s device authenticates (usually automatically) with a unique username upon arrival, we could accurately track the presence of those employees.
For the remainder of employees we still had an accuracy problem. It wasn’t just hardwired workstations which were “always on,” there were other edge cases such as contractors and other personal devices which were restricted to the guest network. What common tools did they login to which could provide a data point?
Lowering the default session time in Google G-Suite to 24 hours would provide a second data point (use of the office public IP address), but this provided two additional problems; it burdens the workers with more frequent logins, and also created false positives for remote workers who used the full-tunnel VPNs.
In the interest of brevity, we left a few minor collection and filtering methods out. As you can see by now we had several sources of data, but we couldn’t trust any one as the source of truth. The result was the creation of a scoring algorithm responsible for making sense of the available data and in order to provide the most accurate result.
In order to collect all this information we needed a system that could continuously consume API data in a reliable way without supervision. We also needed a series of graphs to display the data, ideally with the ability to drill down into the specifics. In the old days we would have written a series of collection scripts and a web application based on a currently popular framework. The problem is these one-off systems tend to break over time for a variety of reasons. They inevitably become the forgotten code running on shadow infrastructure, and fall victim to lack of maintenance.
Big Data to the Rescue
With better data management tools hitting the market each year, we could potentially leverage big data tools to deliver the end product. While this data was immensely valuable to our client and would likely save them six figures in various costs, the project didn’t justify the ongoing cost of the traditional enterprise tools we needed.
For enterprise Business Intelligence implementations, data is collected and aggregated through a process known as ETL or Export, Transform, and Load. These systems can be quite expensive, but an increasing number of these tools are available in the pay-as-you-go cloud services model. For as little as $1.50 a hour, we could leverage Matillion, a robust ETL platform to orchestrate our data acquisition and pump into a storage system.
Traditionally ETL systems pump the data into a data warehouse which is a database designed to deal with massive amounts of data. We had so little data that an expensive data warehouse was not feasible, nor was using a traditional SQL database which was not supported by Matillion. To solve this we leveraged SnowFlake, a data warehouse with pricing based on execution time, or put simply paying only for active use.
Last was building a dashboard with rich graphs, drill down capability, and multi-user access. It would be exorbitantly expensive to build this from scratch, or to leverage an enterprise grade BI platform. AWS came to the rescue with their QuickSight analytics service.
Tying it all Together
Cloud Brigade’s team worked with the stakeholders in the project (namely IT, facilities, and finance) to make sense of the data. We suggested unique ways we could correlate the data from all of the sources and determined the metrics which delivered the best actionable insights.
These projects are not strictly technical, this also requires an understanding and empathy for the people outside of the stakeholder team. We needed to achieve a reasonable business objective without burdening the employees or creating a “big brother” atmosphere.
At the end of the day we were able to provide a high quality and dependable business tool, in a reasonably short period of time, and with a relatively low total cost of ownership. To boot, it was yet another obscure and interesting problem our team got to solve with the right combination of really cool tools. For that we are grateful.
Wanna Learn More About Big Data?
Operating and scaling a professional services company is incredibly challenging. Every element of the business is in constant motion, and cash seems to fly out the door faster than it comes in. In addition, managing the queue of projects, scheduling employees, monitoring sales, and business development are all essential for your organization’s growth.
As there is no one-size-fits-all platform to operate our unique businesses, we all use a collection of management tools that work best for our use cases. Each of these tools provide some type of analytics, usually a combination of reports and dashboards. The problem is that each of these tools report on one facet of your operations, whether that’s accounting, sales, project management, time tracking, or attendance.
Given the fast pace our businesses move, it’s a daunting, if not impossible task
to keep on top of the overall operational health of the organization. Let’s face it,
as good as each tool may be, we simply don’t have time to sift through a dozen
browser tabs of dashboards and reports, much less attempt to mentally map that
data into something meaningful. You simply reach a point where you are flying by
the seat of your pants and you can’t scale.
In 2017, we added Business Intelligence (BI) to our professional services lineup.
While we had plenty of experience with the technical building blocks in the cloud
although we hadn’t had the luxury of aggregating our data sources to get better
analytics on the business. We had been using an increasing number of SaaS
software solutions since 2010, and let me tell you, we were like kids in a candy
store, brimming with ideas around what we could now do with this data.
There were two areas of the business that were the greatest concern of ours,
employee productivity, and the financial health of the company. In the years prior
to using BI, we were aggregating data exports from our accounting system, our
employee attendance records, and our time tracking and invoicing system. To be
frank, it was a pain in the ass and it was done very sporadically. None-the-less it was
very enlightening to discover why our revenue generation was very sporadic at that
time.
As a small organization, things tend to be a little less formal and it takes time to
build up the proper management processes as well as systems to monitor and
enforce policies. Not to say our employees were doing anything bad, we’re just
aware that clock is always running and at some level every minute is an opportunity
to bleed money.
As you probably know, your annual revenue per employee is a function of :
((Annual Working Hours – PTO/Holidays) * % Billable Hours) * Average Hourly Rate
((2080 Hours – 21 Days Off) * 75% Billable Hours) * $150 = $215,100 or $17,925/mo
Your numbers are probably similar, and likely variable based on a number of factors.
As you also know, maintaining a consistent flow of new business coming in, and
keeping your team busy and operating at peak capacity is a constant battle. When
you hit those seasonal lull periods, your employees are billing less hours. While you
can generate monthly billable hour reports from your time tracking software, this
alone does not provide details such as true labor cost per hour of revenue, average
billable rate per employee, percentage of billable vs. paid hours, percentage of
tracked time, and other factors.
As an example :
Individual Contributor Productivity Dashboard
Our first project was centered around this area of the business, and the result was an employee productivity dashboard we released to all of our employees. This serves as a feedback loop to each member of our team, giving them access to their own performance metrics and allvowing them to proactively work toward reaching their monthly goals. Without this information, they simply don’t know their individual contribution to the company until after the fact. At that point it’s too late to course correct when necessary.
What’s Next
If you like what you read here, the Cloud Brigade team offers expert Machine Learning as well as Big Data services to help your organization with its insights. We look forward to hearing from you.
Please reach out to us using our Contact Form with any questions.
If you would like to follow our work, please signup for our newsletter.
Over the past weekend, I participated in my 4th Tech Raising hack-a-thon weekend. In past years I’ve run teams of up to 22 people, but this year I decided to join my friend Spencer Lindsay‘s team as an individual contributor. Spencer is a 3D digital artist I’ve known for about a decade through our co-working space. Spencer had an idea for a location-based augmented reality application for sharing digital objects in the real world. The idea is that you can leave a digital object at a specific location, and share the object with someone, requiring that they show up to that location to find the object. That could be a 3D handwritten note, picture, or perhaps a 3D object.
We were joined by fellow NextSpace alumni Sue Dayton, David Fierstein, and Mike “Doon” Muldoon. We sat in a conference room for two days furiously creating a product from concept to proof of concept, and presented our project to a room full of spectators and a panel of judges. While hack-a-thons often produce a startup company, this was really an opportunity for us to work together on a project. David and Mike were brought in to do programming in Unity which provides a 3D platform with a plugin ecosystem and the ability to author native iOS apps. Sue is a UI/UX designer amongst many other capabilities we needed on our team.
The interesting part of any project, particularly a time-sensitive hack-a-thon, is figuring out where to start. Since our mantra is Failure-Is-Not-An-Option (thanks Gene Krantz), we had to quickly devise a method to divide and conquer individual parts of the project while minimizing the possibility of stepping on each other’s toes. Of course, we used Git to assist us to that end. Since I’m not a 3D artist or Unity coder, my portion of the project was to create the backend for the app. This was necessary to share objects between users, and to manage the user/object data.
My company Cloud Brigade specializes in solving complex technical problems for our customers, and one tool in our offering is Amazon Web Services. As an Amazon partner, this was a cool opportunity to build out a proof of concept serverless backend and at the same time create some related marketing materials that display what we can do for our customers. The above image was created in Cloudcraftwhich is a really cool tool for not only drawing but estimating basic cloud costs.
Building a serverless application is a huge time saver for a project like this, and it was a good opportunity to keep my own skills current. As the CEO of the company, I don’t get to geek out on some of this stuff as much as I would like. For those of you not familiar with serverless, the idea is that by connecting a few modular web services together in AWS, you can avoid spinning up and configuring Linux servers like we used to do in the “Olden Days“. Here are the building blocks I used :
API Gateway
Lambda
Simple Storage Service (S3)
Relational Database Service
Simple Notification Service (for SMS)
I also polished up my Python skills and utilized a few code examples to get me started, and scoured the internet for additional code nuggets I needed to get the rest of the way there. It’s always interesting trying to do something just slightly different than all the common examples show you. One interesting observation I made was that Python code was executing with about half the memory utilization of Javascript under NodeJS.
Next we had a team discussion around what the bare minimum amount of information was needed to be exchanged over the network to create and share what we called a “leaf”. This included a unique user identifier, geo-location data, and an image object. After mapping out the API endpoints on a giant Post-It note on the wall, I fired up MySQL Workbench to create some basic tables for the app.
Next, I created Lambda functions to read and write data to/from the MySQL tables. Because Python under Lambda requires installing the pyMySQL libraries, it’s “easier” to deploy your script with Cloud Formation which can be an iterative process. This is a great article from the AWS blog. If you run into problems, re-read the section of the article because you missed something :-). https://aws.amazon.com/blogs/database/query-your-aws-database-from-your-serverless-application/ Here’s an example of a Lambda function :
One thing I absolutely love about the way AWS architected their services, is that you can simulate input through testing mechanisms right from your browser using just a little bit of JSON. I first tested my Lambda functions before connecting them to the API gateway to make sure my input variables were getting passed to the script and ultimately inserted into the database. Next was on to the API Gateway. This is too complicated to walkthrough here, but the short description is that you define your endpoints (i.e. /createleaf), the HTTP method to use (GET/POST/PUT/etc), a model for the data required to execute the query, and the destination AWS service which is of course Lambda. At this point the backend was ready for the app developers to connect to and send data.
We had an absolutely awesome weekend with our friends and members of our close-knit community in Santa Cruz. We killed it developing a proof of concept, and we’re working on completing our MVP now. You can find out more about this Tech Raising weekend in the coming days on their FaceBook Page. If you are interested in knowing more about Serverless, send me a PM.
Chris
So I’ve been getting a lot of “Hey Congrats on that thing you won, um so what was it???”. This speaks to how much confusion there is around Machine Learning and Artificial Intelligence, and I have shared in this confusion. So allow me to simplify what just happened.
I attended the AWS Summit last week, it’s a free trade show that provides access to learning sessions around Amazon’s cloud offerings. These are the building blocks that are changing, improving, and expediting the way we build technology. One of the sessions was an introduction to #machinelearning using a toy car called #deepracer, a reference to “Deep Learning”.
In the two hour session, the speaker introduced us to a model called “reinforcement learning”, and utilized slides depicting a good dog getting a reward, and a bad dog not getting a reward. In machine learning, this reward system is implemented using points. You get more points for the desired behavior, and less points for the undesirable behavior.
OK, so how does this tie into the toy car and the race? #AWS pulled a slick move and basically #gamified this complex subject by connecting the technology to something we all love – toy cars and racing. By doing this they made Machine Learning approachable by a wider audience.
To do this, AWS built a feature into their console that allows you to control the driving characteristics of the car, and build this into a Machine Learning “model”. This model then gets trained by a farm of processors in the Amazon cloud, and you can watch your car “learn” how to drive in a virtual environment.
In order to work in this environment, you do need to know your way-ish around the AWS console, and know a little bit how to code in some language. Fortunately with 23 years in tech I had both of these skills. What also helped me out was my previous experience as an automotive tech, and my love and understanding of driving sports cars. All of this influenced my approach to tweaking the parameters provided in the model.
We only had 45 minutes to play with this environment in the workshop, and after playing with the default model, and then building my own based on some assumptions, I has to sit back and watch my model train and learn how to drive by failing. I didn’t have the luxury of allowing my model to train for the full 60 minutes, so I had to cut it short. At the end of the session the presenter said that we could take our model down to the racetrack on the conference floor and race our model in the real world.
With a little help from our friends at @matillion who loaned my a USB dongle (#grateful), I stood in line at the race track and waited my turn. I had low expectations as to how my model would perform, nor did I realize there were prizes for winning, I just did it for fun. My first lap went absolutely perfect and placed as the fastest lap time of 10.43 seconds. I was shocked. Every subsequent lap didn’t do as well, so I think someone must have been watching over me that day.
With less than an hour left for competitors to challenge my time, I milled around the track and did a short interview with @Ryan Myrehn, a real world “pit reporter” AWS hired for this event. As the end of summit reception started, I was whisked off as the champion and presented with commemorative jacket and trophy on stage, and was interviewed for some blog posts and promotional videos. I didn’t have time to get nervous, it just happened so fast.
As it turns out I also won my own AWS DeepRacer 1/18 scale autonomous car, and an expenses paid trip to AWS re:Invent 2019 in Las Vegas in December where I will compete with 20+ other Summit participants from around the world. Until then, I am now sufficiently motivated to dig deeper into Machine Learning on the AWS platform.
At the start of my day I had intended on finding out more about Machine Learning (ML) and Artificial Intelligence (AI). Why? As the CEO of a software development and cloud services company, there is no denying the relevance of these recently available technologies. Although few of our current customers are asking for these features, I am certain that we will need to incorporate ML and AI into the software we develop. While it’s not my job as CEO to code or to learn these technologies deeply, it is my job to champion adoption by our team and to know we’re implementing currently accepted technology and best practices.
See you at the races kids!
Chris
Nothing Found
It seems we can’t find what you’re looking for. Perhaps searching can help.
We want to hear from you!
Interested in more information? Would like our help on a project? Have a question or idea we can help become a reality?